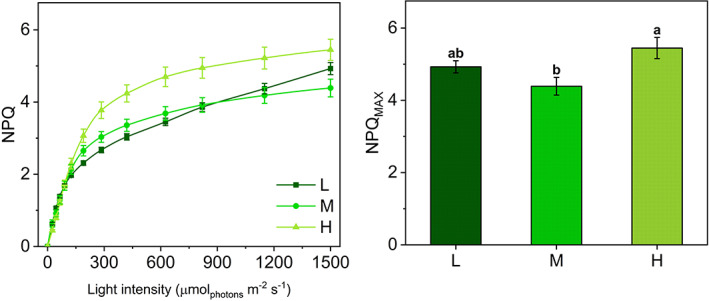
FIGURE 2.

NPQ light‐response curves and maximum NPQ values in Selaginella martensii acclimated to three natural light regimes. (A) NPQ‐light response curves of deep shade (L, dark green), intermediate shade (M, green), and high light (H, pale green) plants during 60‐min exposure to increasing actinic light intensities. Average values ±standard error for n = 12 (L), 16 (M), 18 (H). (B) Maximum NPQ values (NPQMAX) reached at the end of the light curve. Histogram represents average values ±standard error for n = 12 (L), 16 (M), 18 (H); different letters indicate a significant difference at P < 0.05, as determined using one‐factor ANOVA followed by Tukey's test
