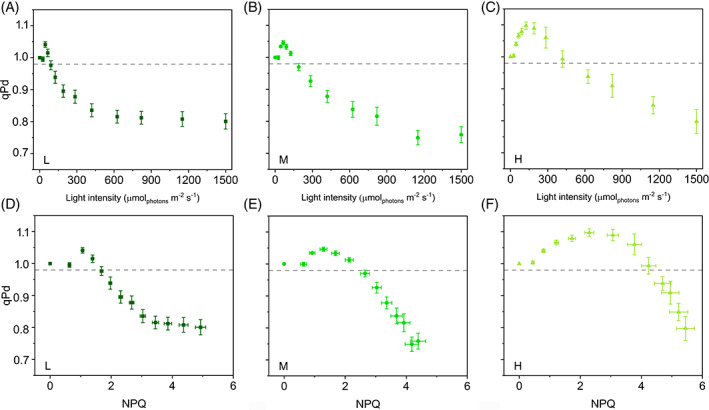
FIGURE 3.

Photochemical quenching measured in the dark (qPd) in the hypothesis of a homogeneous antenna system in Selaginella martensii acclimated to three natural light regimes. (A–C) qPd‐light response curves of deep shade (L, dark green), intermediate shade (M, green), and high light (H, pale green) plants during 60‐min exposure to increasing actinic light intensities. (D–F) qPd versus NPQ curves of L, M, and H plants. In all cases, some data points correspond to qPd > 1, excluding the correctness of the homogeneous antenna model. Dashed‐gray horizontal line represents the photoinactivation threshold of qPd = 0.98. Average values ± standard error for n = 12 (L), 16 (M), 18 (H)
