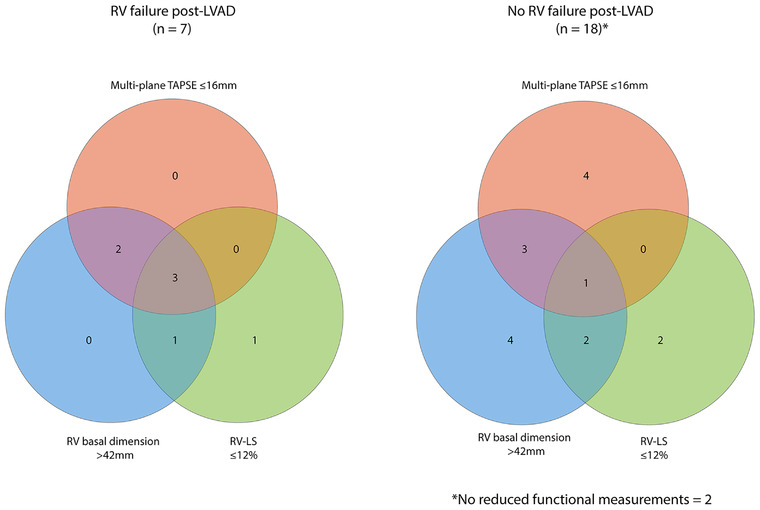
FIGURE 4.

Venn diagram demonstrating incidence and combination of pre‐operative echocardiographic right sided impairment in study population. Left sided diagram represents patients with significant post‐LVAD RV failure. Right sided diagram represents no significant post‐LVAD RV failure. Cut‐off values are shown in the figure. Pink circle, multi‐plane tricuspid annular plane systolic excursion (TAPSE); blue circle, right ventricular (RV) basal dimension; green circle, right ventricular longitudinal strain (RV‐LS)
