Figure 3.
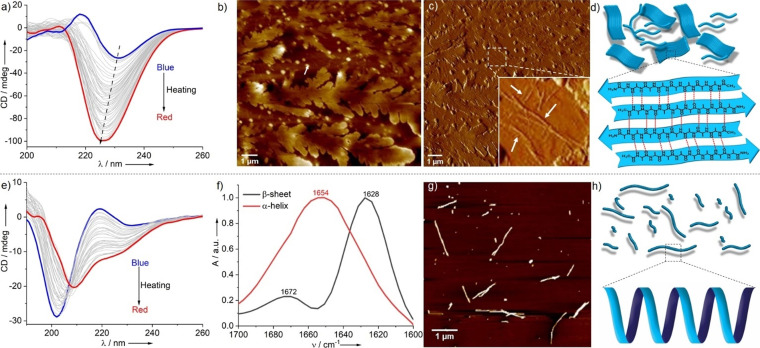
Temperature‐dependent CD spectra of PEP‐1 in PBS at C=5×10⁻⁴ M (a) and C=5×10⁻⁵ M (e); b) AFM image (height) of PEP‐1 at 363 K (C=5×10⁻⁴ M); c) corresponding phase image of (b) and enlarged area where nanofibers are highlighted by white arrows (inset); d) schematic representation of 2D sheet‐like structures and corresponding well‐defined β‐sheet conformations; f) FT‐IR spectra of PEP‐1 in PBS for both concentrations (C=5×10⁻⁴ M and 5×10⁻⁵ M) at 363 K; g) AFM image of PEP‐1 at 363 K (C=5×10⁻⁵ M); h) graphical illustration of short nanofibers along with α‐helix as secondary structures at 363 K.

