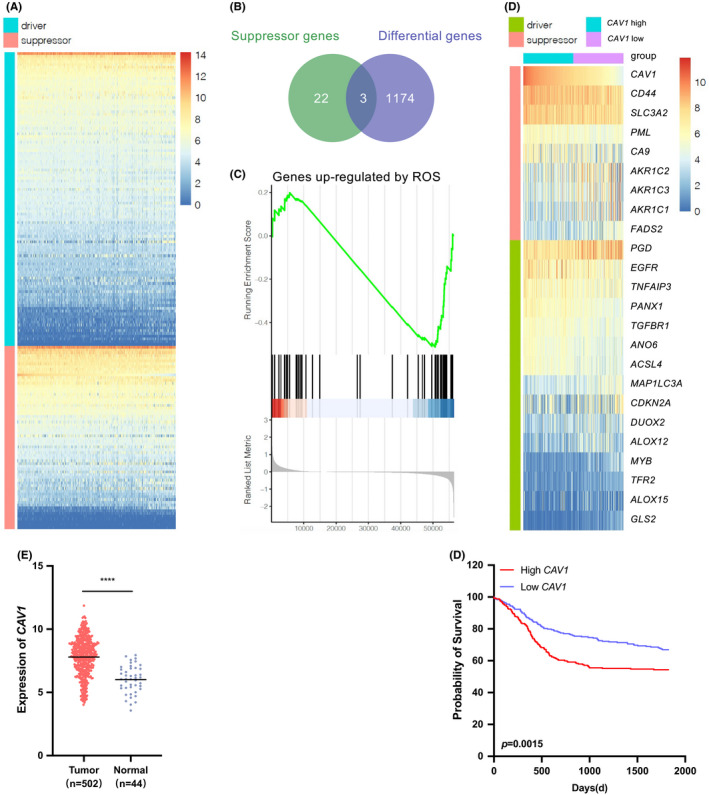
FIGURE 1.

CAV1 is associated with poorer prognosis and ferroptosis in TCGA HNSCC dataset. A. Heatmap showed the expression of ferroptosis driver and suppressor genes in HNSCC. B. Venn diagram showed 3 genes both expressed in selective ferroptosis suppressor group and differential expressed genes in HNSCC from TCGA. C. The GSEA analysis showed the expression of upregulated genes mediated by ROS, on the basis of highly expression of CAV1. D. Heatmap showed the different expression of genes that were related to CAV1. E. The expression of CAV1 in HNSCC cancer and normal tissues. (p < 0.0001) F. The overall survival rate was significantly different between the high and low expression of CAV1 in HNSCC patients (p = 0.0015). Data originated from TCGA database. (ns, no significant difference, · p < 0.1, * p < 0.05, ** p < 0.01, *** p < 0.001, **** p < 0.0001)
