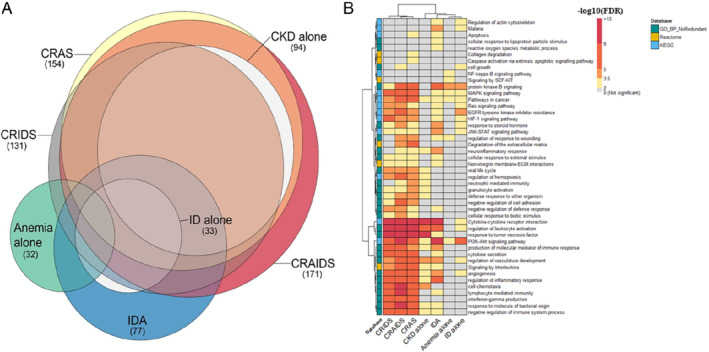
Figure 3.

(A) Euler diagram showing overlap of the found biomarkers across the different syndromes. The size of each circle is proportional to the number of differentially expressed biomarkers found (numbers between brackets). (B) Heatmap showing enriched pathways and biological processes. The rows correspond to the pathways resulted from the affinity propagation algorithm for redundancy reduction, and the columns correspond to the studied syndromes. The colour gradient of each cell refers to the −log 10 (FDR) value, indicating the over‐representation significance of each pathway (see colour key). The full list of over‐represented pathways per syndrome can be found in online supplementary Appendix S2 . CKD, chronic kidney disease; CRAIDS, cardio‐renal anaemia iron deficiency syndrome; CRAS, cardio‐renal anaemia syndrome; CRIDS, cardio‐renal iron deficiency syndrome; ECM, extracellular matrix; EGFR, epidermal growth factor receptor; FDR, false discovery rate; HIF‐1, hypoxia‐inducible factor 1; ID, iron deficiency; IDA, iron deficiency anaemia; JAK‐STAT, Janus kinase (JAK)‐signal transducer and activator of transcription; KEGG, Kyoto Encyclopedia of Genes and Genomes; MAPK, mitogen‐activated protein kinase; NF, nuclear factor; PI3K, phosphatidylinositol‐3‐kinase; SCF, stem cell factor.
