
Fig 1.
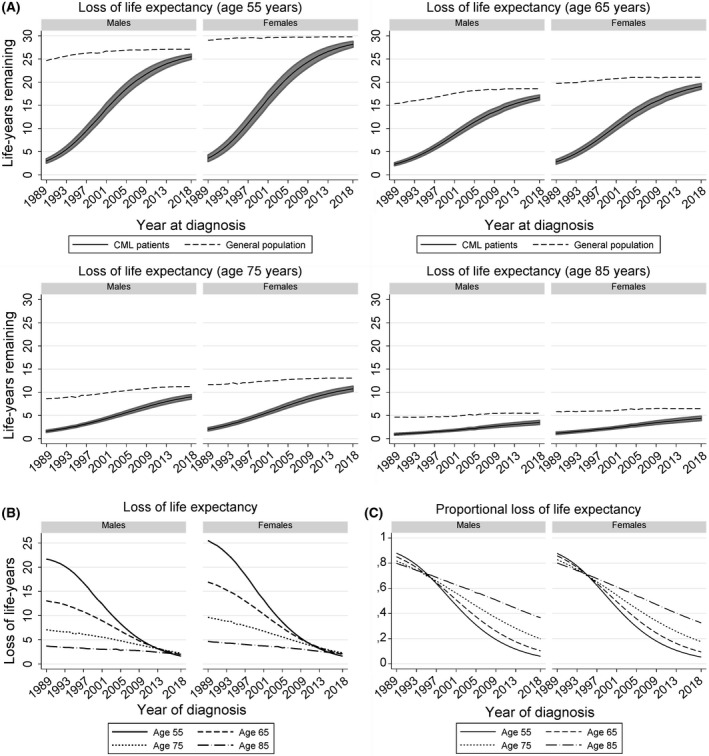
Trends in various survival measures of patients with chronic myeloid leukaemia diagnosed in the Netherlands between 1989 and 2018. (A) depicts the life expectancy of the general population (dashed lines) and patients with chronic myeloid leukaemia (CML; solid lines) by year of diagnosis for four ages, stratified by sex. The shaded area around the life expectancy of patients with CML portrays the 95% confidence interval for the point estimates, which was obtained using the Delta method. (B) presents the loss of life expectancy of patients with CML by year of diagnosis for four ages, stratified by sex. (C) presents the proportional loss of life expectancy of patients with CML by year of diagnosis for four ages, stratified by sex.