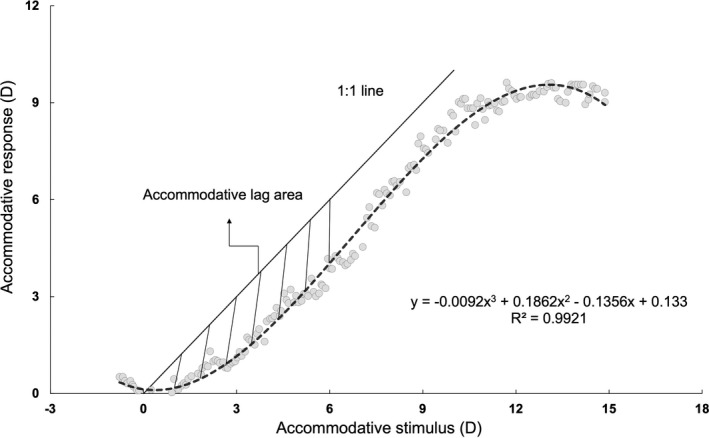
FIGURE 1.

Representative example of a child's accommodative stimulus‐response curve and accommodative lag area. The curve was fitted with a 3‐D polynomial equation (dashed line). The solid black line indicates the 1:1 response to the accommodative stimulus. The shaded area represents the accommodative lag area between the dashed line and the solid line from 0 to 6 D Badal stimulus. D, dioptre
