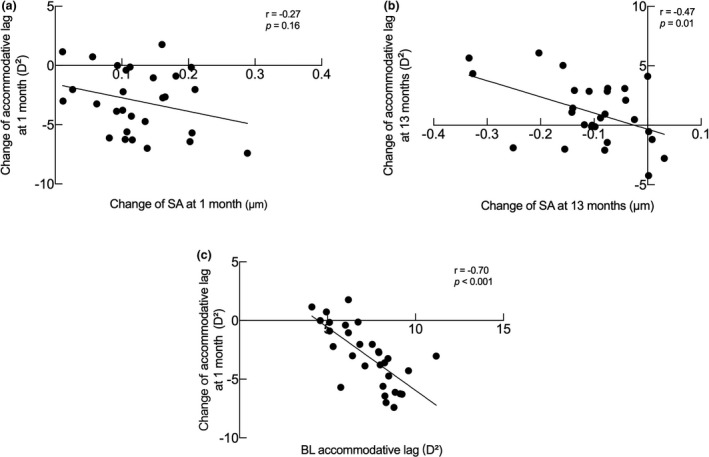
FIGURE 4.

Correlation analysis of accommodation changes in the OK group. (a) Scatter plot for changes of SA against accommodative lag area changes at 1 month of OK treatment. (b) Scatter plot for changes of SA against accommodative lag area changes after ceasing OK treatment. (c) Scatter plot for accommodative lag area at baseline against changes at 1 month. Change at 1 month, difference between 1 month and baseline; change at 13 months, difference between 13 months and 12 months. BL, baseline; D, dioptre; OK, orthokeratology; SA, spherical aberration
