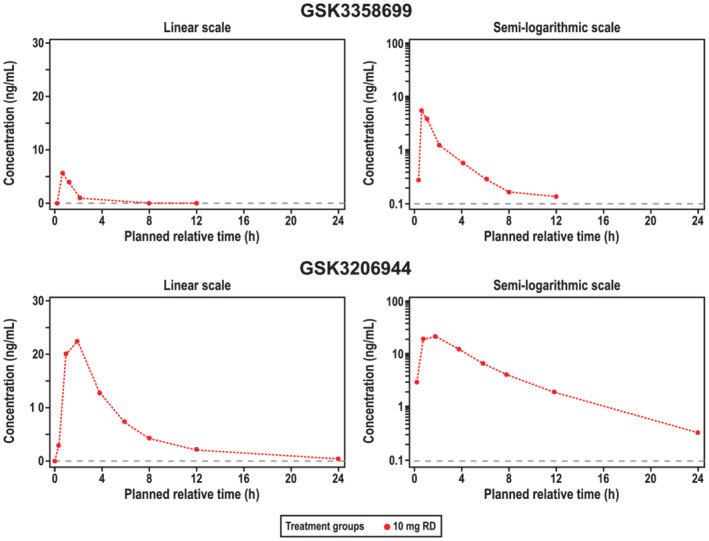
FIGURE 4.

Median plasma concentration over time on day 1 of part C of the study (pharmacokinetic populationa). Median plasma concentrations of GSK3358699 (top) and the metabolite GSK3206944 (bottom) over 48 hours following treatment with 10 mg of GSK3358699 are shown on a linear (left) and semilogarithmic scale (right). As only two participants had a PK profile for day 14, only a median concentration‐time profile for day 1 is presented. RD, repeat dose. aThe pharmacokinetic population included all participants who received an active dose of the study drug and for whom pharmacokinetic samples were obtained and analysed
