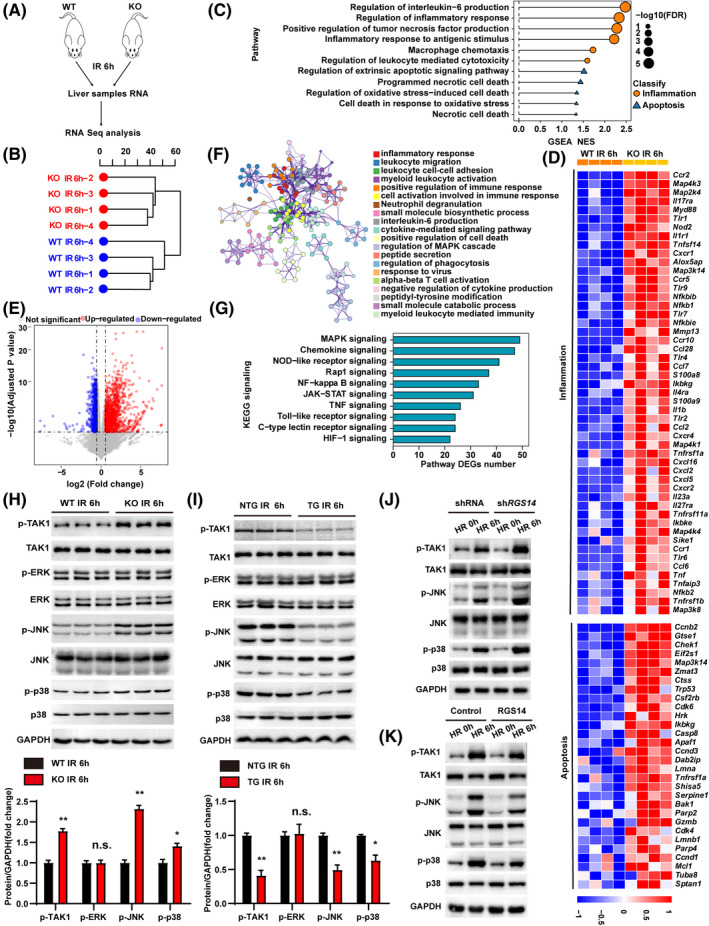
FIGURE 6.

RGS14 inactivates TAK1–JNK/p38 signaling during hepatic IRI. (A) RNA‐seq construction plan for liver tissues from RGS14‐KO and WT mice at 6 h after hepatic IRI. (B) Hierarchical clustering dendrogram showing the distribution profiles of RNA‐seq. (C) GSEA of RNA‐seq data showing the enrichment of inflammation and apoptosis‐related pathways in the livers of RGS14‐KO and WT mice after hepatic IRI. The 11 most significantly enriched pathways are shown. Black dots represent −log10 p values for the enriched gene ontology pathways. Orange dots represent inflammation‐related pathways. Blue triangles represent apoptosis‐related pathways. (D) Heatmap showing the expression of inflammation‐related and apoptosis‐related genes of the leading‐edge subset in the livers of RGS14‐KO and WT mice detected by RNA‐seq analyses. (E) Volcano map showing DEGs in livers of RGS14‐KO and WT mice after hepatic IRI. The red dots represent up‐regulated DEGs, and the blue dots represent down‐regulated DEGs. The gray dots represent genes without significant differences in expression. (F) Metascape enrichment analysis showing groups of several categories based on gene functional relevance, and construction of a network was based on relevance and similarity. In the figure, different colors are used to represent different categories. (G) The top 10 most significantly enriched pathways contributing to RGS14 function were determined by KEGG enrichment analysis of the livers of RGS14‐KO and WT mice after hepatic IRI. (H) Western blot analysis of the levels of total and phosphorylated TAK1, JNK, ERK, and p38 in RGS14‐KO and WT mice at 6 h after IR (n = 3/group). (I) Western blot analysis of the levels of total and phosphorylated TAK1, JNK, ERK, and p38 in NTG and RGS14‐TG mice at 6 h after IR (n = 3/group). (J) Western blot analysis of the levels of total and phosphorylated TAK1, JNK, and p38 in shRNA control or RGS14‐konckdown hepatocytes subjected to HR challenge. (K) Western blot analysis of the levels of total and phosphorylated TAK1, JNK, and p38 in Flag control or RGS14‐overexpressing hepatocytes subjected to HR challenge. GAPDH served as a loading control. (A–G) n = 4/group. (J–K) n = 3 independent experiments. All data are shown as the mean ± SD. *p < 0.05, **p < 0.01. Alox5ap, arachidonate 5‐lipoxygenase‐activating protein; Apaf1, apoptotic peptidase activating factor 1; Bak1, BCL2‐antagonist/killer 1; Casp8, caspase 8; Ccl2, C‐C motif chemokine 2; Ccl28, C‐C motif chemokine 28; Ccl6, C‐C motif chemokine 6; Ccl7, C‐C motif chemokine 7; Ccnb2, cyclin B2; Ccnd1, cyclin D1; Ccnd3, cyclin D3; Ccr1, C‐C chemokine receptor type 1; Ccr10, C‐C chemokine receptor type 10; Ccr2, C‐C chemokine receptor type 2; Ccr5, C‐C chemokine receptor type 5; Cdk4, cyclin‐dependent kinase 4; Cdk6, cyclin dependent kinase 6; Chek1, checkpoint kinase 1; Csf2rb, colony stimulating factor 2 receptor subunit beta; Ctss, cathepsin S; Cxcl16, C‐X‐C motif chemokine 16; Cxcl2, C‐X‐C motif chemokine 2; Cxcl5, C‐X‐C motif chemokine 5; Cxcr1, C‐X‐C chemokine receptor type 1; Cxcr2, C‐X‐C chemokine receptor type 2; Cxcr4, C‐X‐C chemokine receptor type 4; Dab2ip, Disabled 2 interacting protein; Eif2s1, eukaryotic translation initiation factor 2 subunit 1 alpha; FDR, false discovery rate; Gtse1, G two S phase expressed protein 1; Gzmb, granzyme B; HIF‐1, hypoxia‐inducible factor 1; Hrk, harakiri, BCL2 interacting protein; Ikbke, inhibitor of kappaB kinase epsilon; Ikbkg, inhibitor of kappaB kinase gamma; Il17ra, interleukin‐17 receptor A; Il1b, interleukin‐1 beta; Il1r1 , interleukin‐1 receptor type 1; Il23a, interleukin‐23 subunit alpha; Il27ra, interleukin‐27 receptor subunit alpha; Il4ra, interleukin‐4 receptor subunit alpha; JAK‐STAT, Janus kinase–signal transducer and activator of transcription; Lmna, lamin‐A; Lmnb1, lamin B1; Map2k4, mitogen‐activated protein kinase kinase 4; Map3k14, mitogen‐activated protein kinase kinase kinase 14; Map3k8, mitogen‐activated protein kinase kinase kinase 8; Map4k1, mitogen‐activated protein kinase kinase kinase kinase 1; Map4k3, mitogen‐activated protein kinase kinase kinase kinase 3; Map4k4, mitogen‐activated protein kinase kinase kinase kinase 4; Mcl1, myeloid cell leukemia sequence 1; Mmp13, matrix metallopeptidase 13; Myd88, myeloid differentiation primary response gene 88; n.s., not significant; NES, normalized enrichment score; Nfkb1, nuclear factor NF‐kappa‐B p105 subunit; Nfkb2, nuclear factor NF‐kappa‐B p100 subunit; Nfkbib, NF‐kappa‐B inhibitor beta; Nfkbie, NF‐kappa‐B inhibitor epsilon; NOD, nonobese diabetic; Nod2, nucleotide‐binding oligomerization domain containing 2; Parp2, poly (ADP‐ribose) polymerase family, member 2; Parp4, poly (ADP‐ribose) polymerase family, member 4; S100a8, S100 calcium binding protein A8; S100a9, S100 calcium binding protein A9; Serpine1, serine (or cysteine) peptidase inhibitor, clade E, member 1; Shisa5, shisa family member 5; Sike1, suppressor of IKBKE 1; Sptan1, spectrin alpha, non‐erythrocytic 1; Tlr1, toll‐like receptor 1; Tlr2, toll‐like receptor 2; Tlr4, toll‐like receptor 4; Tlr6, toll‐like receptor 6; Tlr7, toll‐like receptor 7; Tlr9, toll‐like receptor 9; Tnf, tumor necrosis factor; Tnfaip3, tumor necrosis factor alpha‐induced protein 3; Tnfrsf11a, tumor necrosis factor receptor superfamily member 11A; Tnfrsf1a, tumor necrosis factor receptor superfamily member 1A; Tnfrsf1b, tumor necrosis factor receptor superfamily member 1B; Tnfsf14, tumor necrosis factor ligand superfamily member 14; Trp53, transformation related protein 53; Tuba8, tubulin alpha 8; Zmat3, zinc finger matrin type 3
