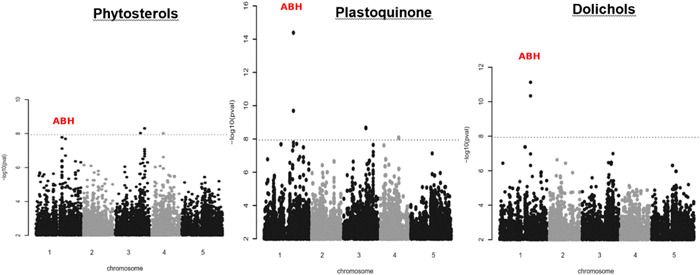
Figure 3.

Manhattan plot of genome‐wide associations for phytosterols, plastoquinone and dolichols. The dotted horizontal lines indicate a significance level of 0.05 after Bonferroni correction for multiple testing (see Section 2). Manhattan plot of genome‐wide association results for polyprenols, chlorophylls and tocopherols are shown in Figure S7 [Color figure can be viewed at wileyonlinelibrary.com]
