Figure 4.

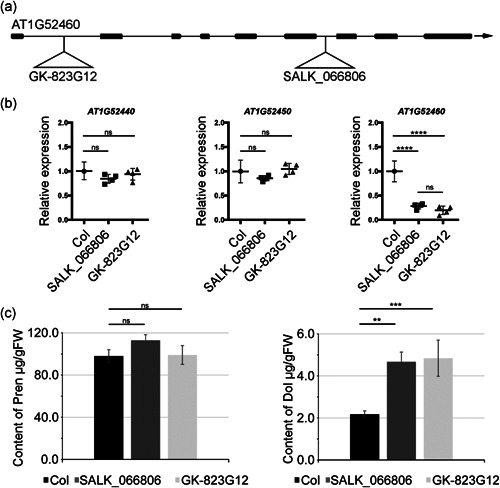
Effect of AT1G52460 deficiency on the level of transcripts of neighbouring genes and the content of polyisoprenoids. (a) AT1G52460 gene structure. Exons and introns are indicated by thick and thin lines, respectively. The T‐DNA insertion sites in two independent mutant lines: SALK_066806 and GK_823G12 are depicted. (b) Levels of AT1G52440, AT1G52450 and AT1G52460 transcripts (qPCR analysis) in the leaves of 3‐week‐old plants—WT (Col) and AT1G52460‐deficient plants were compared. p ≤ 0.0001 (one‐way ANOVA followed by Tukey post‐tests); ns, non‐significant. (c) The content of Dols and Prens estimated in leaves of 3‐week‐old plants using HPLC/UV, shown are means ± SD of five independent biological replicates. The phenotypic appearance of 4‐week‐old detached leaves of AT1G52460‐deficient line (SALK_066806, abh heterozygous mutant) and wild‐type (Col‐0) plants grown in soil is shown in Figure S8. Seed germination and segregation analysis of F1 progeny of self‐pollinated of heterozygous SALK_066806 and GK_823G12 lines is shown in Table S5
