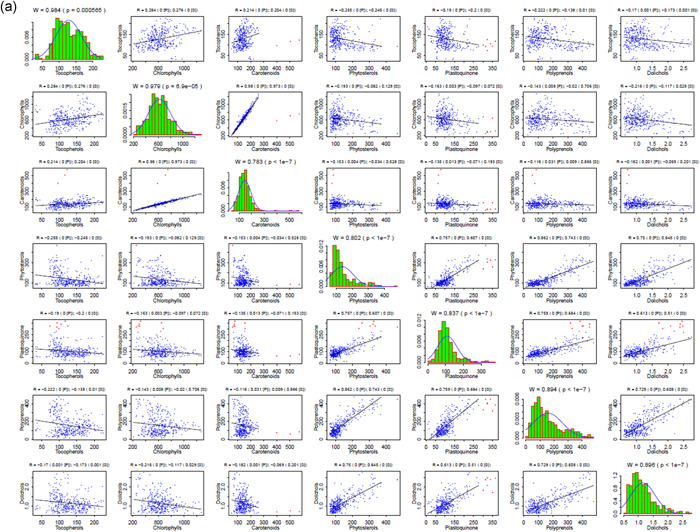
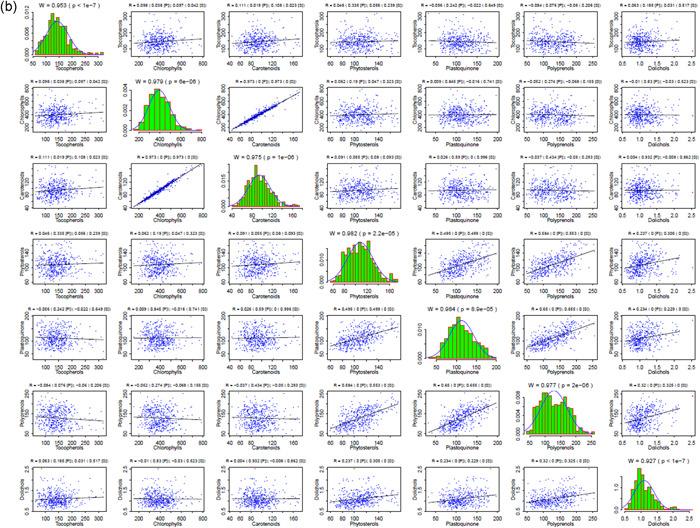
Figure 5.
Correlations between the content of seven metabolites estimated in the seedlings of Arabidopsis accessions (a) and the EstC mapping population (b). The original distributions (green bars), together with the approximation of the normal distribution of the data (blue curve) with outliers removed, are presented on the diagonal. Correlation patterns for each metabolite pair are presented at the appropriate intersection; note that outliers (red dots) were not taken into consideration for the analysis. Above each diagonal panel, the Shapiro–Wilk statistics (W, p) for normal distribution is presented, while for out‐of‐diagonal panels Pearson (P) and Spearman (S) correlation coefficients together with the associated significance levels are shown (please note that ‘0’ means p < 1e−7). Bearing in mind the statistically significant deviations from normal distribution shown in the diagonal panels, the significance of the observed correlations should be interpreted in terms of the Spearman rather than Pearson coefficient (see Section 2). Cumulative distribution functions of the content of seven studied metabolites analysed in the seedlings of Arabidopsis accessions and AI‐RILs are shown in Figure S9 [Color figure can be viewed at wileyonlinelibrary.com]


