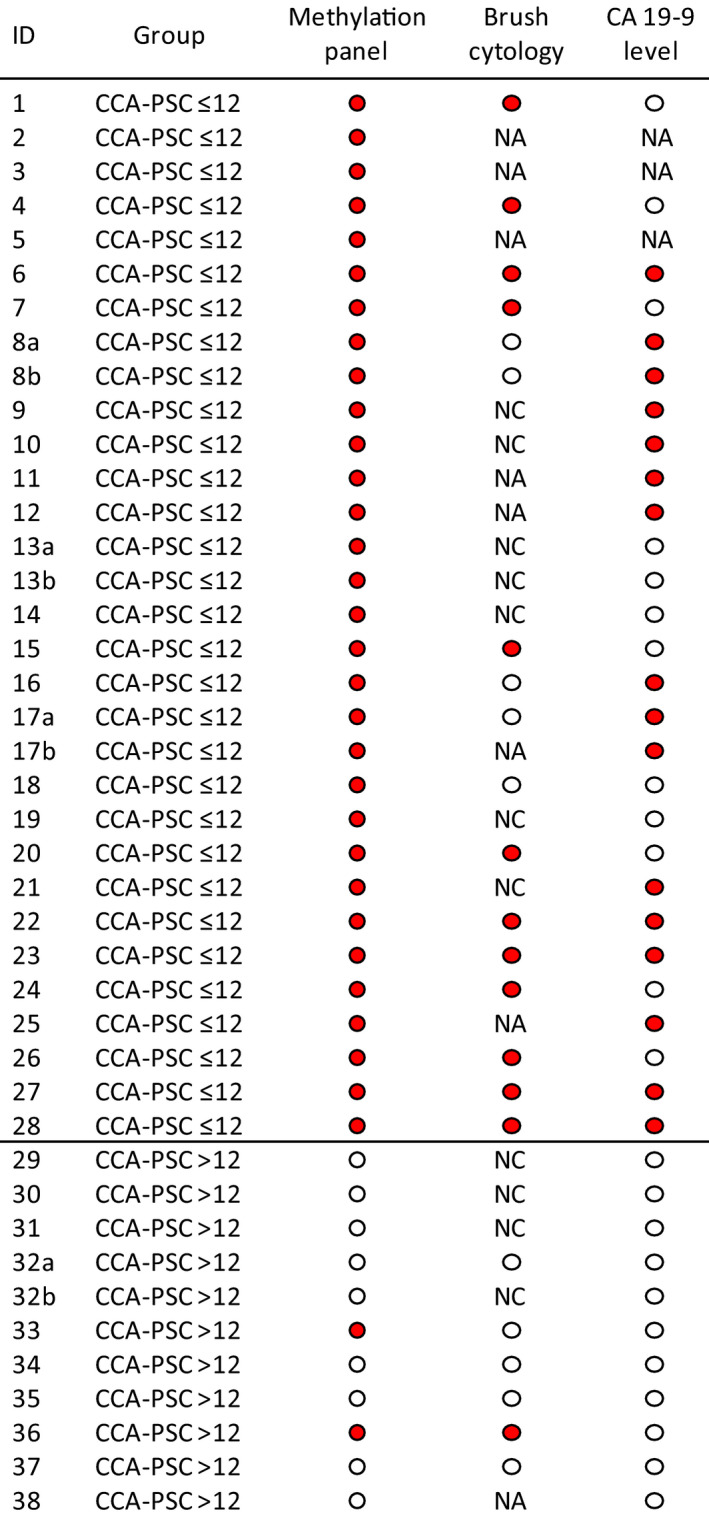
FIGURE 3.

Comparison of DNA methylation in bile with CA 19‐9 levels and biliary brush cytology. Red circle, sample scored as positive for methylation/cytology/CA 19‐9; white circle, sample scored as negative for methylation/cytology/CA 19‐9. The methylation panel was considered positive if one or more of the four biomarkers were methylated. Biliary brush cytology was scored positive if low/moderate‐grade or high‐grade dysplasia was identified and negative if only normal cells were identified. If more than one brush sample was taken, the case was scored based on the highest grade of dysplasia found. In cases where the sample was scored between two grades of dysplasia, the highest grade was used. For CA 19‐9 levels, 100 U/ml was used as the threshold: a CA 19‐9 level > 100 U/ml was considered positive, while a CA 19‐9 level < 100 U/ml was considered negative. The “b” samples are not included in the biomarker analysis. NA, not available; NC, acellular or nondiagnostic/scarce material not sufficient for further scoring
