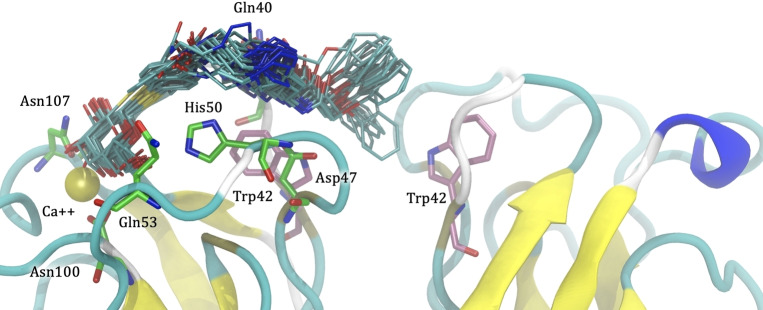
Figure 2.
Molecular dynamics simulation of 1 in complex with LecA. Several snapshots of ligand 1 from the 240 ns molecular dynamic trajectory are depicted as cyan sticks. The phenoxy group of 1 is partially entering the central pocket of LecA and interacts with the Trp42 of both monomers (depicted as pink sticks). The galactosyl residue firmly coordinates the calcium ion (yellow sphere) in the carbohydrate binding site, and its β‐phenyl aglycon binds to His50. Residues involved in hydrogen bonds to the galactosyl moiety are depicted by green sticks.

