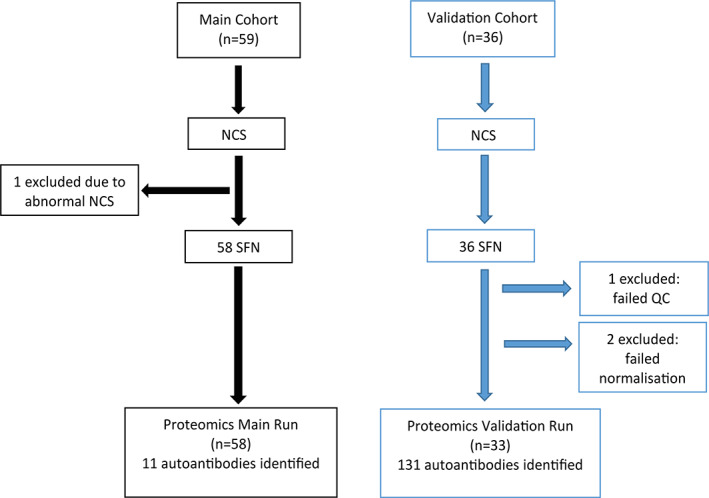
FIGURE 2.

Flowchart of recruitment, proteomics testing, and data analysis of small fiber neuropathy (SFN) patients. Fifty‐nine patients were recruited to the main cohort. One patient was excluded due to failure in meeting diagnostic criteria, and the remaining samples (n = 58) were analyzed and compared with 20 healthy controls who were age‐ and gender‐matched. Thirty‐six patients were recruited to the validation cohort and were run independently and compared with 20 healthy controls. Three samples were excluded due to failure in quality control (QC) or normalization (n = 33). Bioinformatic analysis was performed to identify reproducible autoantigens. NCS = nerve conduction studies. [Color figure can be viewed at www.annalsofneurology.org]
