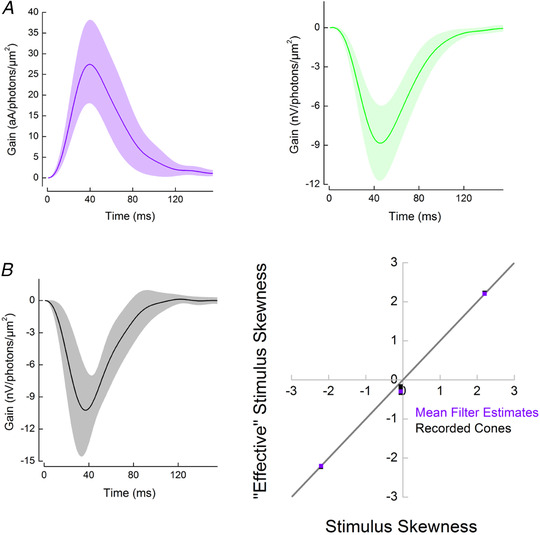
Figure 4. Temporal filtering by cones does not change the skewness of stimuli from skew stimulus set 2.

A, the mean cone impulse response functions (±SD) estimated from the photocurrent responses (violet, n = 8) and from the voltage responses (green, n = 9) to skew stimulus set 1. Individual impulse response functions calculated for each cone were used to estimate the levels of ‘effective’ skew delivered by skew stimulus set 1 (Fig. 3E ). The mean impulse response function of the photocurrent was used during the selection process for skew stimulus set 2. B, left panel, the mean cone impulse response function (±SD) estimated from the voltage responses to for skew stimulus set 2 (n = 7). Right panel, skewness of the ‘effective’ stimuli as a function of the skewness of the light stimuli for skew stimulus set 2. Violet squares correspond to the ‘effective’ skewness obtained by convolving the light stimuli with the mean photocurrent impulse response function estimated from responses to skew stimulus set 1 shown in A. Black squares depict the ‘effective’ skewness of each cone response recorded under skew stimulus set 2. This was estimated by convolving each skew stimulus set 2 stimulus with the cone impulse response functions used to calculate B, left panel. Note that to simplify the visualization of the right panel of B, the cone response ‘effective’ skews (black) were multiplied by minus one. The grey line describes the condition where temporal filtering does not affect stimulus skewness. Given that all squares are aligned with the grey line, the ‘effective’ skewness is approximately equal to the original light stimulus skewness [for zero skew, ‘effective’ skews were 0.26 (0.06); for the ±2.2 skews, ‘effective’ skews were ±2.2 (0.01)]. [Colour figure can be viewed at wileyonlinelibrary.com]
