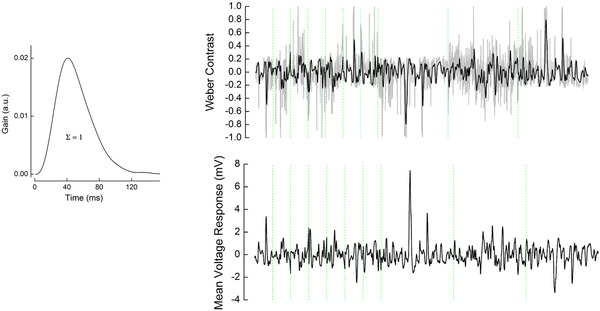
Figure 7. ‘Effective’ Weber contrast steps.

Left panel, mean impulse response function used to obtain ‘effective’ Weber contrast. The mean impulse response was estimated by averaging the individual voltage response impulse response functions of all cells for all stimuli (n = 16; Fig. 4A , right panel, and Fig. 8B ). This mean was scaled such that the integral under its curve was one. Right panel, top, grey line indicates the original light stimuli of skew stimulus sets 1 and 2 converted to Weber contrast steps. Black line indicates the ‘effective’ Weber contrast steps obtained by the convolution of the original Weber contrast steps with the mean impulse response function shown on the left. Right panel, bottom, the averaged cone voltage response to each set of stimuli. For both top and bottom panels, the green dotted lines separate the different stimuli stretches during which the effective skews were (from left to right): −1.6, −0.1, 0.1, −0.6, 0.07, 1.6, 0.6, −2.2, −0.3 and 2.2. [Colour figure can be viewed at wileyonlinelibrary.com]
