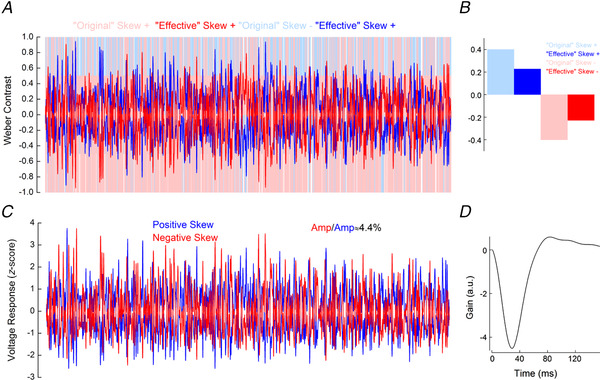
Figure 9. Simulated responses of cat cone photoreceptors.

A, light blue and light red lines depict the positively and negatively skewed stimuli used by Bonin et al. (2006) and here for the simulation. Blue and red lines depict the ‘effective’ positively and negatively skewed stimuli, obtained by the convolution of the ‘original’ stimuli with the impulse response function shown in D. B, comparison of the skews of the ‘original’ and ‘effective’ positively (blue) and negatively (red) skewed stimuli. Owing to temporal filtering, the ‘effective’ stimuli are almost symmetric around the mean, their skew range having decreased from ±0.4 to approximately ±0.2. C, simulated cone voltage responses to the positively (blue) and negatively (red) skewed stimuli. The response amplitude to the negatively skewed stimulus was 4% higher than the response amplitude to the positively skewed stimulus. The simulated voltage response amplitudes were quantified by their standard deviations, as for Fig. 5C . Parameters for the simulation are listed in Table 1. D, impulse response function derived from the simulated cat cone voltage responses. This impulse response function was used to estimate the ‘effective’ stimuli shown in A. [Colour figure can be viewed at wileyonlinelibrary.com]
