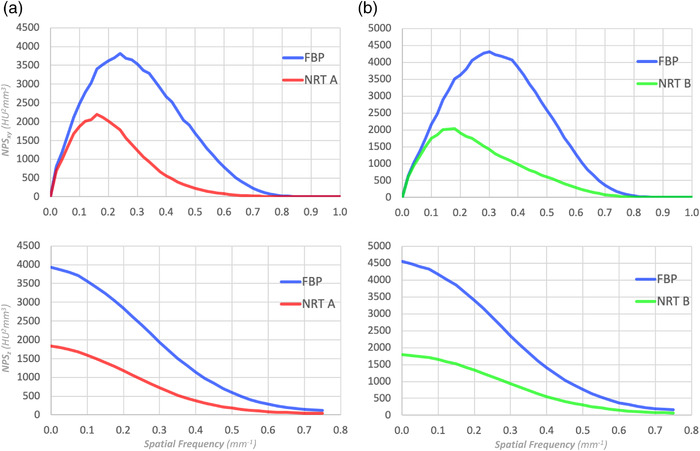
FIGURE 2.

(a) and (b) are two examples of the xy‐plane and z‐directional NPSs of the FBP and NRT images from two different CT scanners. Since the NPSs of the FBP images (blue) are different, it is not possible to simply compare NPSs of NRT A (red) and B (green) to draw conclusion
