FIGURE 3.

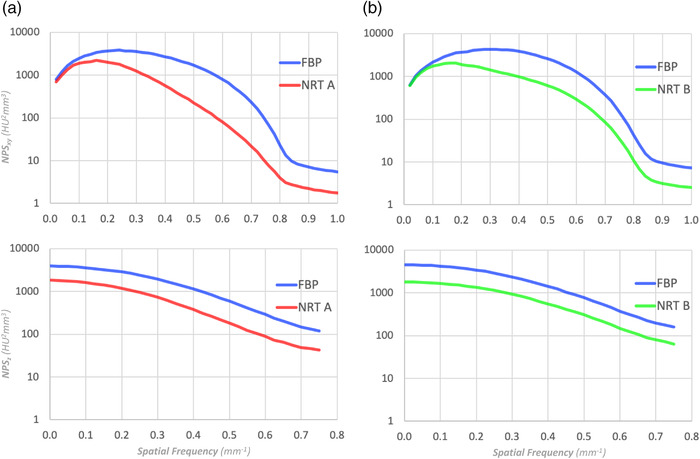
Log scale representation of NPS shown in (a) and (b) of Figure 2. Even with the log scale, it is difficult to objectively recognize the subtle differences between (a) and (b)

Log scale representation of NPS shown in (a) and (b) of Figure 2. Even with the log scale, it is difficult to objectively recognize the subtle differences between (a) and (b)