
FIGURE 9.
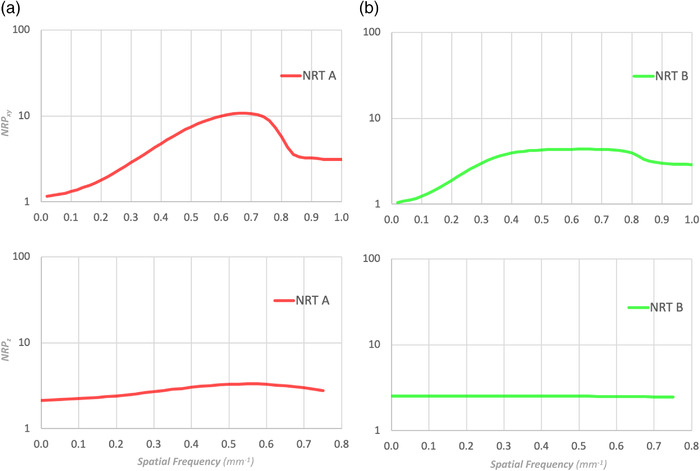
The xy‐plane and z‐axis NRP of the NRTs in Figure 2: (a) NRT A and (b) NRT B. The two NRPs can be compared even when the NPS of the FBP images are different
Official websites use .gov
A
.gov website belongs to an official
government organization in the United States.
Secure .gov websites use HTTPS
A lock (
) or https:// means you've safely
connected to the .gov website. Share sensitive
information only on official, secure websites.
The xy‐plane and z‐axis NRP of the NRTs in Figure 2: (a) NRT A and (b) NRT B. The two NRPs can be compared even when the NPS of the FBP images are different