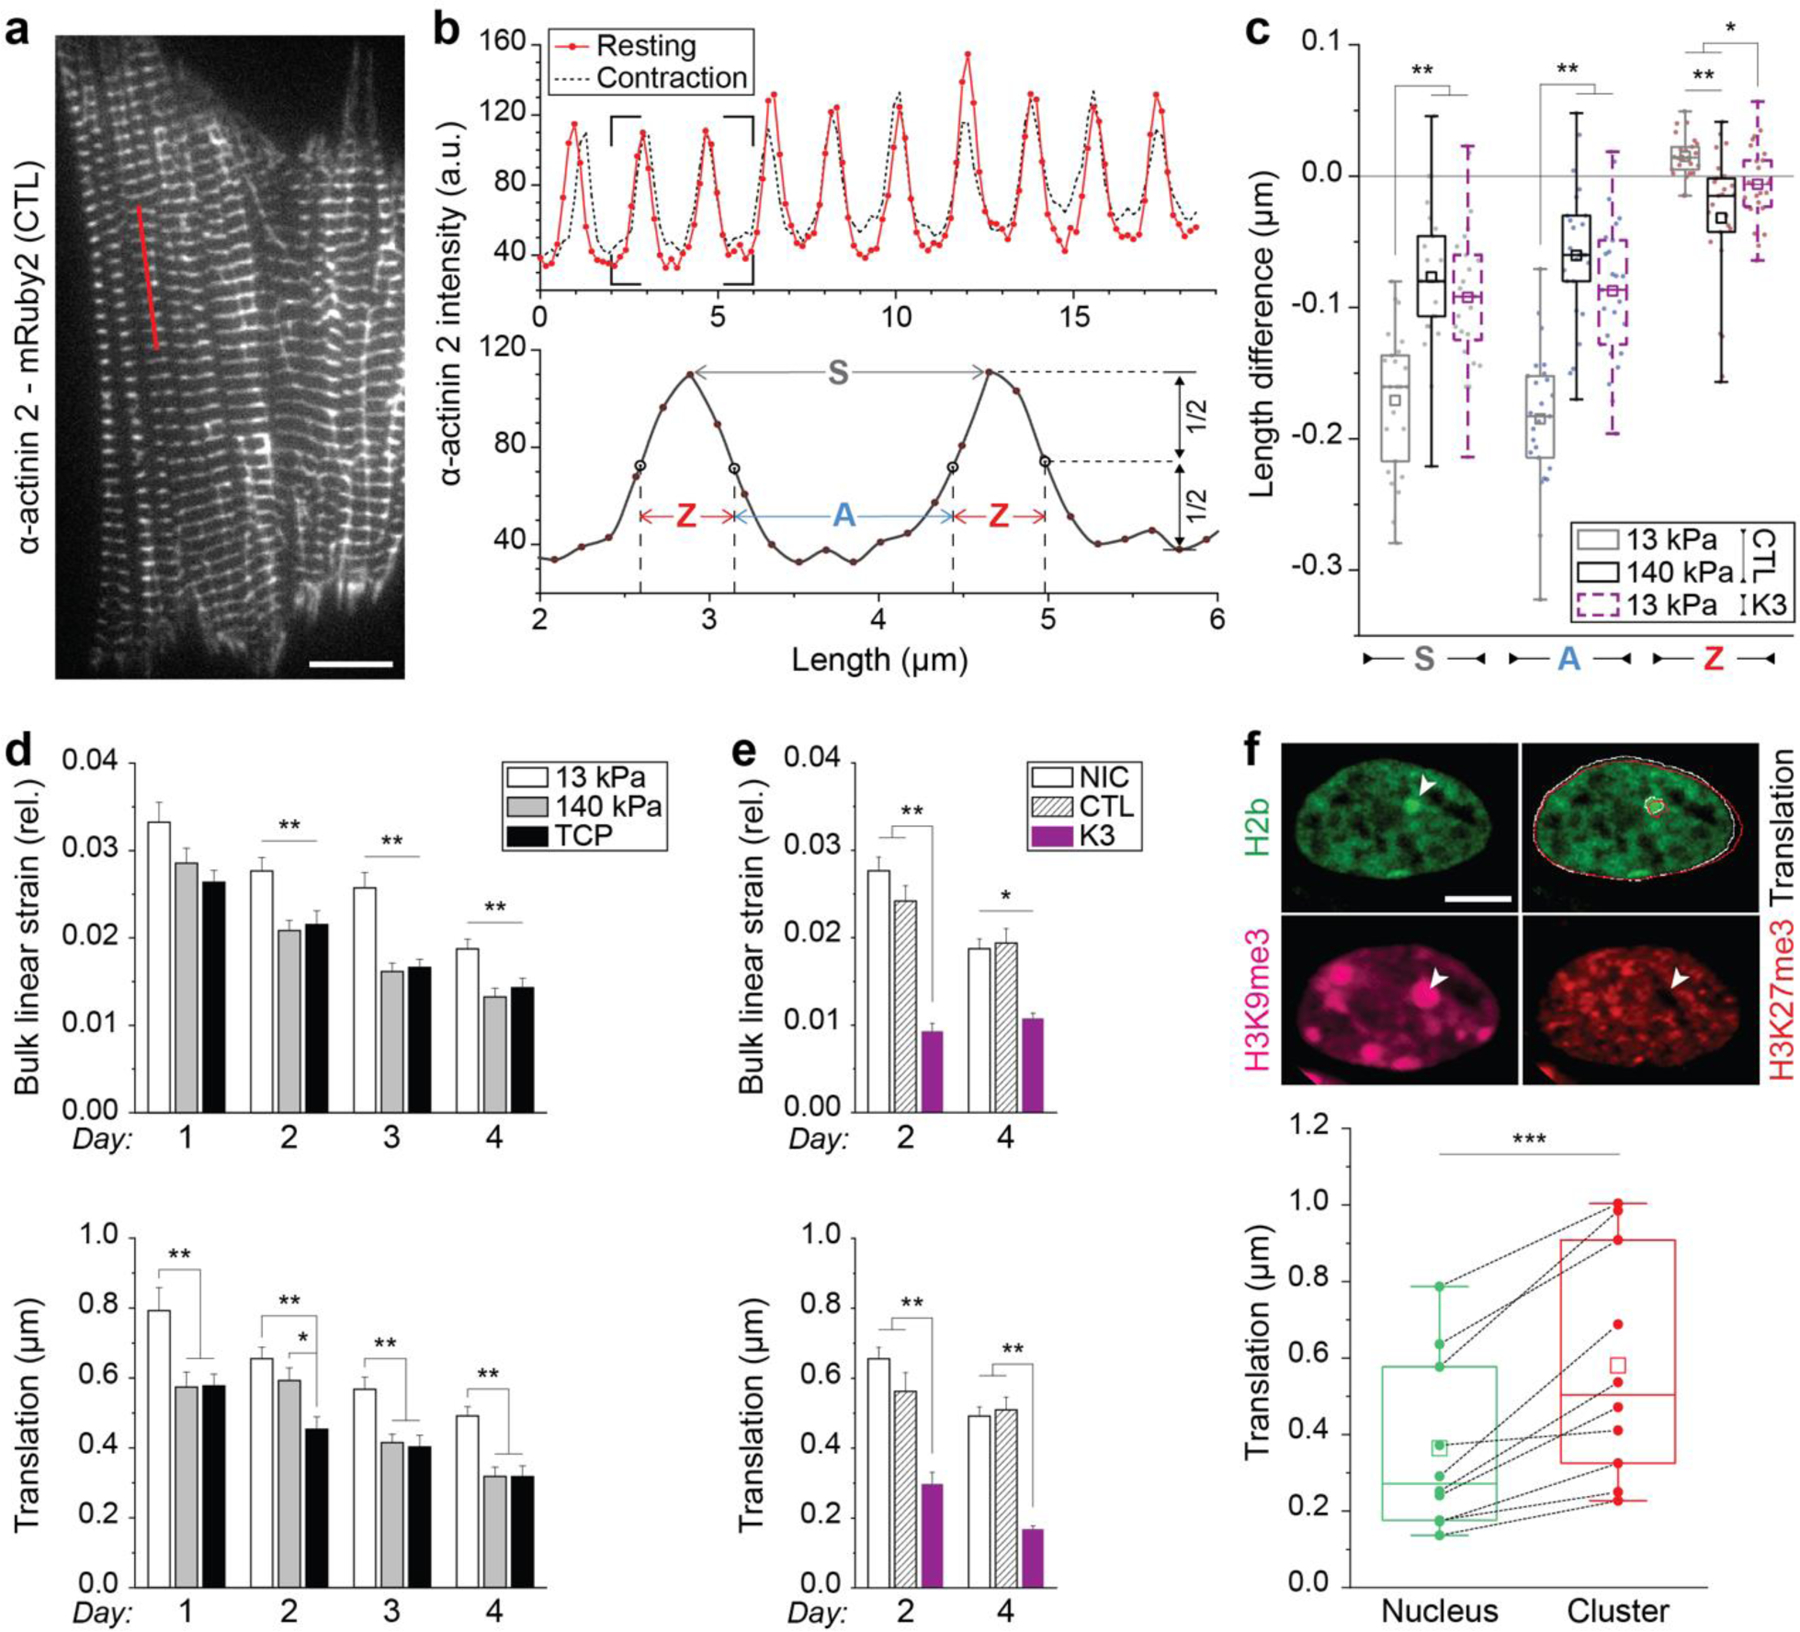
Extended Fig. 6: Stiff substrates reduce myofibril contractility in embryonic CMs.

a) CMs were infected with the adenoviral decoupling vector K3 (see Fig. 6a) or control vector CTL (shown) on day one and image series of myofibril contraction were recorded on day two via fluorescently tagged α-actinin 2. See also Videos 1-3. Scale=10 µm. b) Top: α-actinin 2 intensity profile, as indicated by a red line in c), before (resting) and during contraction. Bottom: Close-up of two intensity peaks. Analysis of intensity profiles was used to determine the difference in length of overall sarcomeres (S), A-bands (A) and Z-disks (Z) during contraction. c) Control infected CMs on stiff PDMS (140 kPa, CTL) and decoupled CMs on soft PDMS (13 kPa, K3) showed inhibited contraction as overall sarcomere and A-band shortening as well as Z-disk extension was abrogated compared to control infected CMs on soft PDMS (13 kPa, CTL); n=25 from 5 exp.; 1W-ANOVA: * p<0.05, ** p<0.01. d) Image series of CM nuclei cultured on either soft (13 kPa) PDMS, stiff (140 kPa) PDMS or TCP were recorded during contraction and bulk linear strain and translational movement of nuclei were determined over four days. Nuclei of CMs cultured on soft substrates showed higher bulk linear strain and translational movement compared to stiff PDMS and TCP; SEM; n>44 from 4 exp.; 1W-ANOVA: * p<0.05, ** p<0.01. e) Bulk linear strain and translational movement of CM nuclei were determined after LINC disruption on day two (24h post infection) and day four. Decoupled nuclei (K3, n=32) showed lower bulk linear strain and translational movement compared to cells infected with the control vector (CTL, n=32) or non-infected control cells (NIC, n=67); SEM; from 4 exp.; 1W-ANOVA: * p<0.05, ** p>0.01. f) Image stacks of beating CM nuclei were recorded on day two after which cells were stained for H3K9me3 and H3K27me3. Analysis of the translational movement of the nucleus and of dense, H3K9me3-rich heterochromatin clusters showed, that movement was higher for intra-nuclear heterochromatin than bulk movement of their respective nuclei during contractions. White and red outlines indicate nuclear and cluster boundary during rest and peak contraction, respectively; n=10 from 3 exp.; T-test: *** p<0.001; scale=5 µm.
