
Extended Fig. 8: Extended analysis of intranuclear strains during CM contraction.
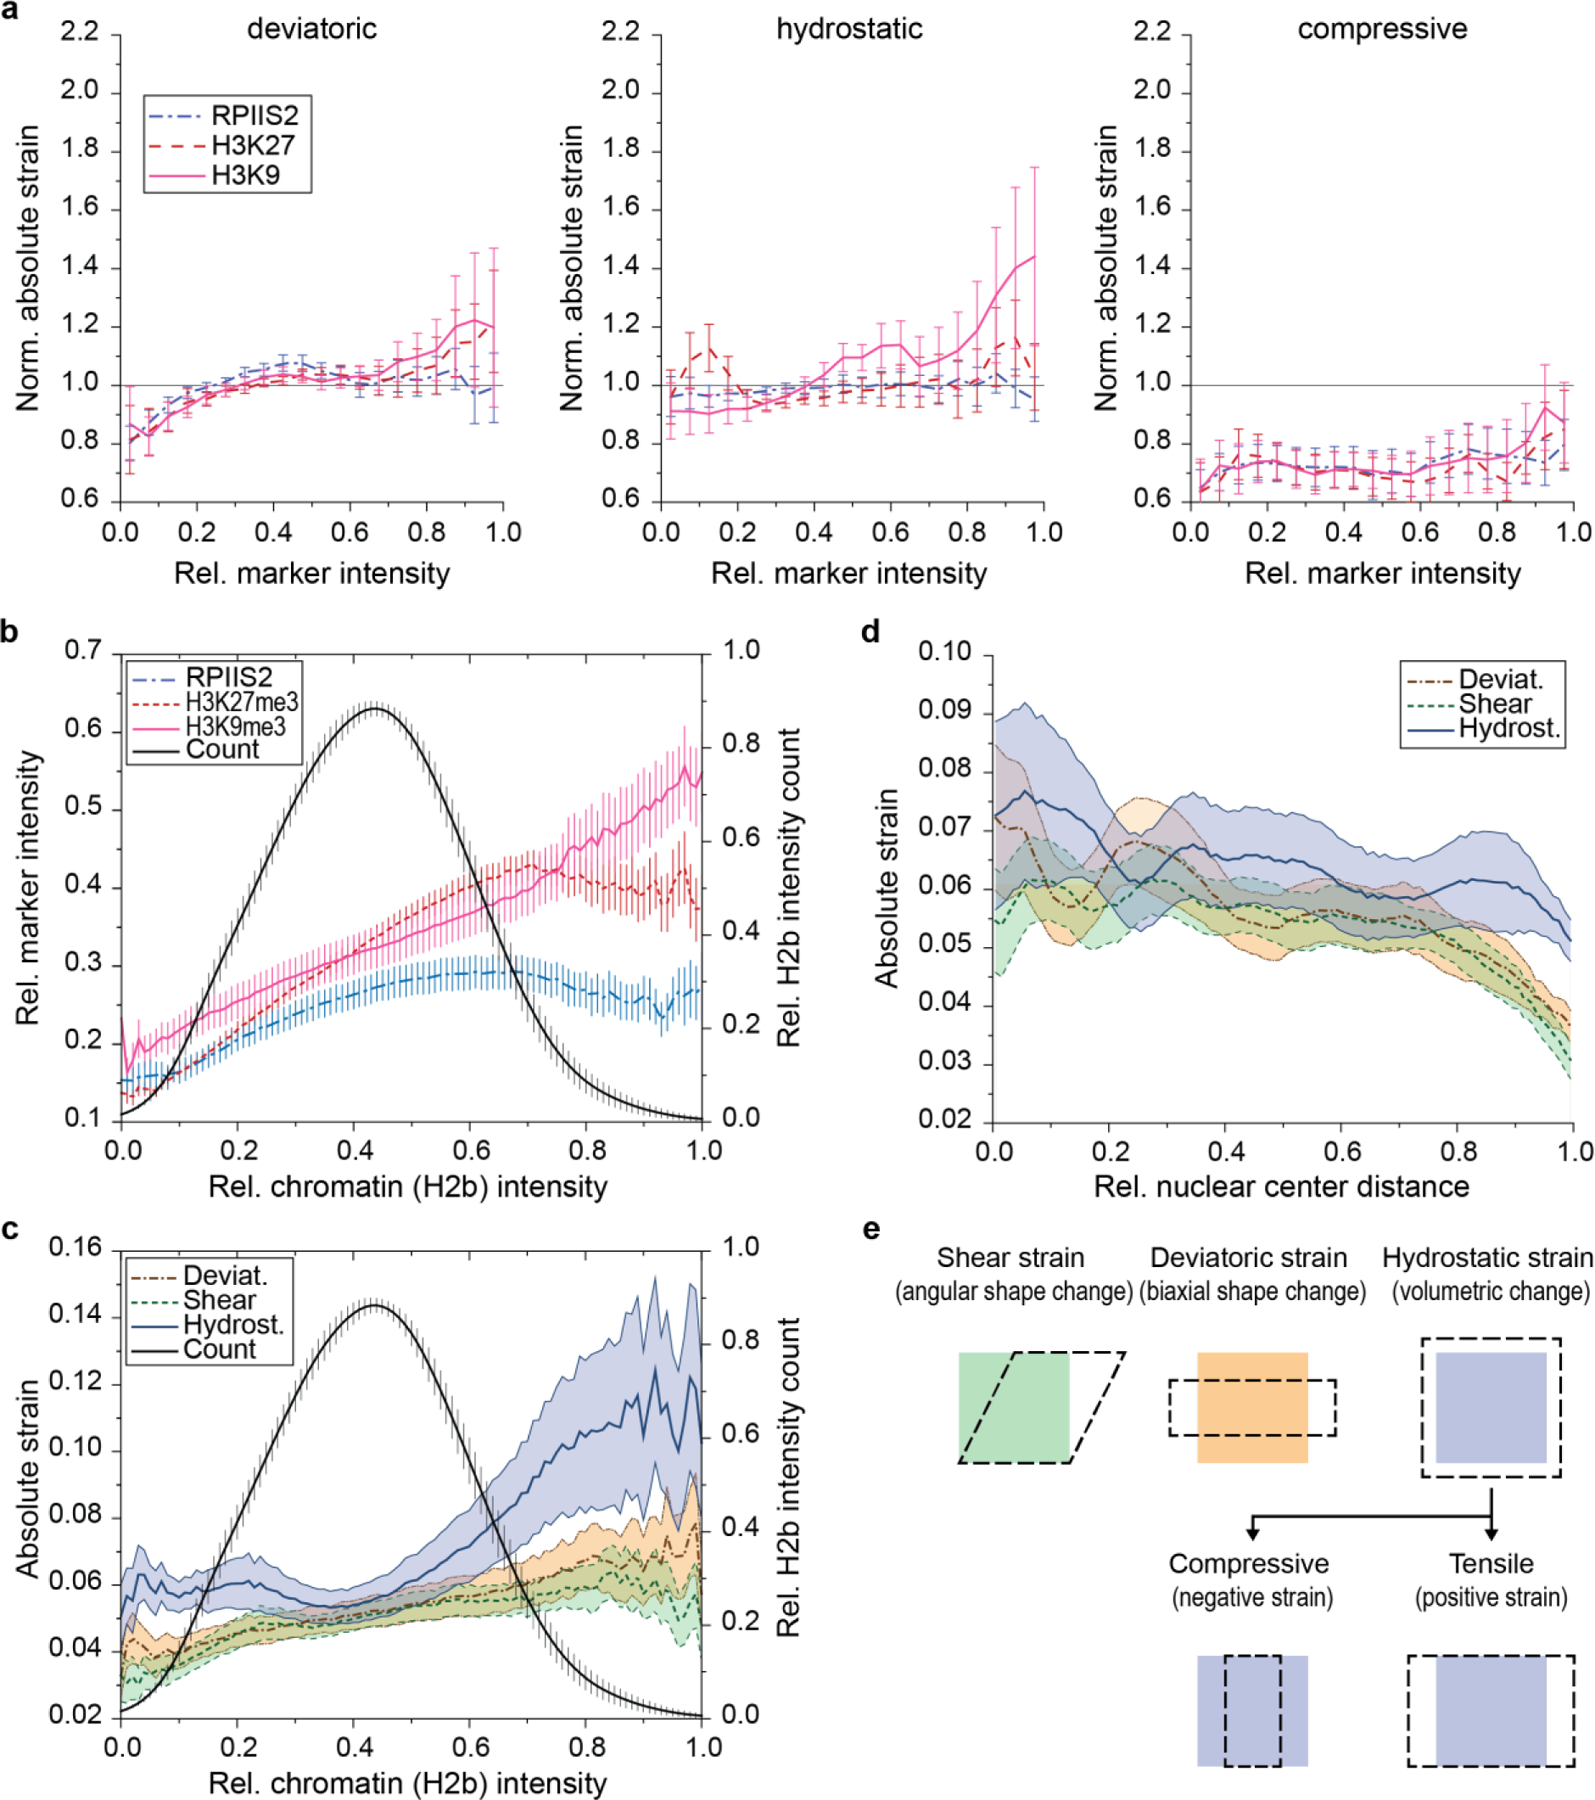
Embryonic CMs were cultured on soft (13 kPa) PDMS for two days. Intranuclear strain maps of CM nuclei during contraction were generated via deformation microscopy after which cells were stained for H3K9me3, H3K27me3 or actively transcribed chromatin (RPIIS2) and strain occupancy for chromatin markers was analyzed (see Fig. 7). a) Intranuclear strains were analyzed over chromatin marker intensities. b, c) Intranuclear strains and chromatin marker intensities were analyzed independent of each other with respect to chromatin density as judged by H2b intensity. Chromatin density distribution (histogram) is represented as relative count on the right y-axis. Hydrostatic strains are lowest around medium chromatin density (density histogram peak) and increases for denser chromatin which is primarily occupied by H3K9me3 modifications. SEM; n=20 from 5 exp. d) Intranuclear strains were analyzed over distance to the nuclear center. Strains declined towards the nuclear border, excluding the possibility of increased strain association of H3K9me3-marked chromatin due to its proximity to the periphery. e) Visual representation of different strain types.