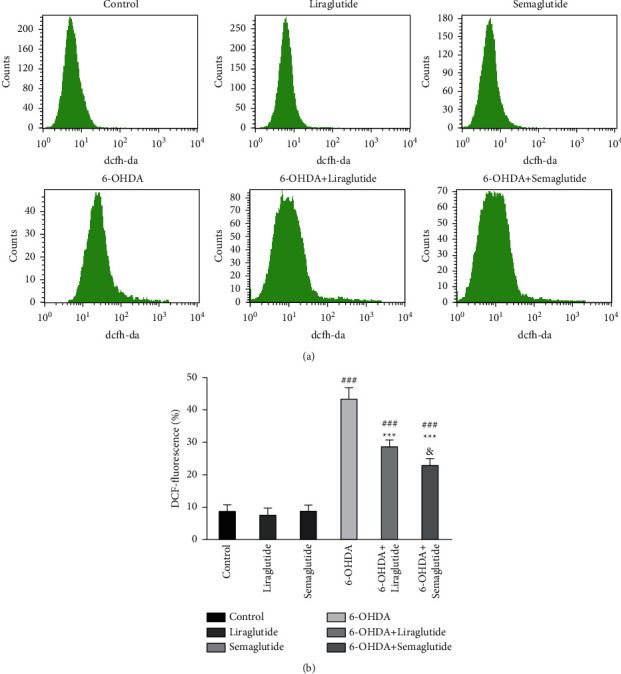
Figure 3.

Changes in ROS production in SH-SY5Y cells. (a) Detection of ROS by flow cytometry. (b) ROS expression was upregulated in the 6-OHDA group (###P < 0.001 vs. the control group). Semaglutide and liraglutide normalized ROS expression (∗∗∗P < 0.001 vs. 6-OHDA group) and semaglutide was significantly more effective (&P < 0.05 vs. 6-OHDA + liraglutide group). All data were expressed as mean ± standard deviation (n = 4).
