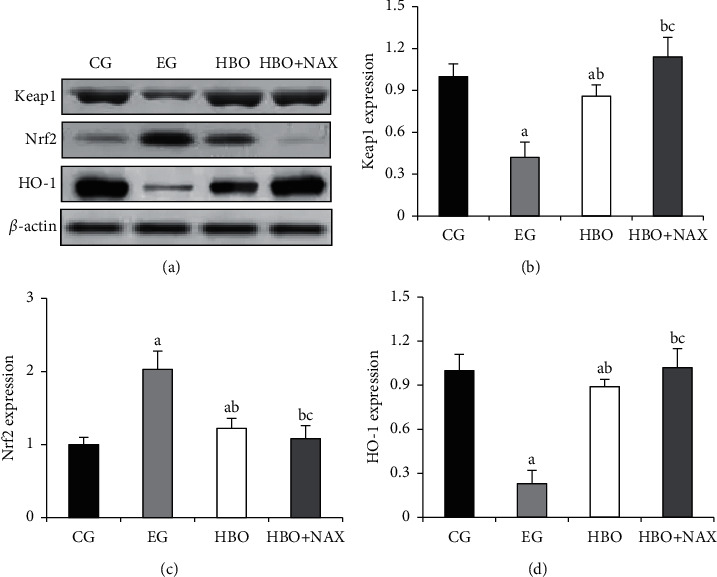
Figure 12.

Comparison of the expressions of Keap1, Nrf2, and HO-1 protein in the liver of mice in each group. Note: (a) the Western blot detection results; (b) the expression of Keap1; (c) the expression of Nrf2; and (d) the expression of HO-1; a, b, and c meant P < 0.05 compared to the CG, EG, and HBO group, respectively.
