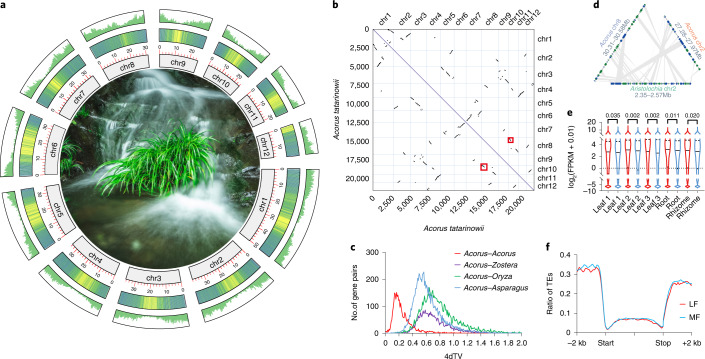
Fig. 1. Genome assembly and a WGD of Acorus.
a, Circos plot of Acorus genome assembly. From outer to inner circles: gene density, TE density, pseudochromosome length and Acrorus in an aquatic habitat. b, Scatter plot of Acorus intraspecific synteny. c, Density distributions of syntenic paralogues of Acorus and syntenic orthologues between Acorus and other monocots according to their 4dTV divergence. d, An illustration of biased subgenome fractionation between two homologous Acorus regions when compared with Aristolochia. e, Violin plot showing significantly higher gene expression in the LF subgenome (shown in red) than in the MF subgenome (shown in blue) for five tissues. Exact P values shown on the top of each violin plot are from one-sided paired t tests. f, Differences in average TE density along genes and flanking regions between duplicates residing in LF blocks and MF blocks.

