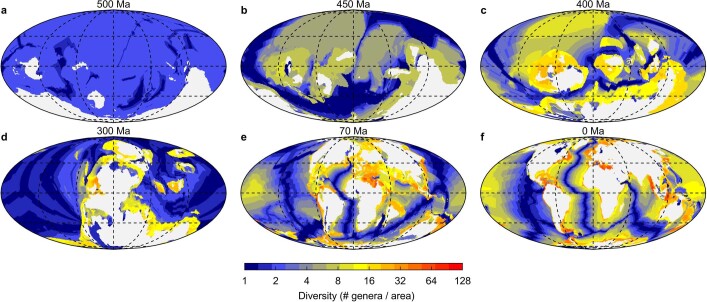
Extended Data Fig. 8. Testing the effect of environmental forcings.
Spatial distribution of marine animal diversity (# genera / area) in the Cambrian (Guzhangian, 500 Ma), Late Ordovician (Katian, 450 Ma), Early Devonian (Emsian, 400 Ma), Late Carboniferous (Pennsylvanian, 300 Ma), Late Cretaceous (Maastrichtian, 70 Ma) and present generated by the calibrated logistic model after imposing the pattern of mass extinctions extracted from the fossil diversity curve of Sepkoski20. This model run uses the following parameters: Q10 = 1 (no temperature dependence), Kfood = 0 molC m−2y−1 (no food dependence), net diversification rate limits (ρmin − ρmax) = 0.001-0.035 Myr−1, and a Kmin to Kmax range between 12 and 123 genera.

