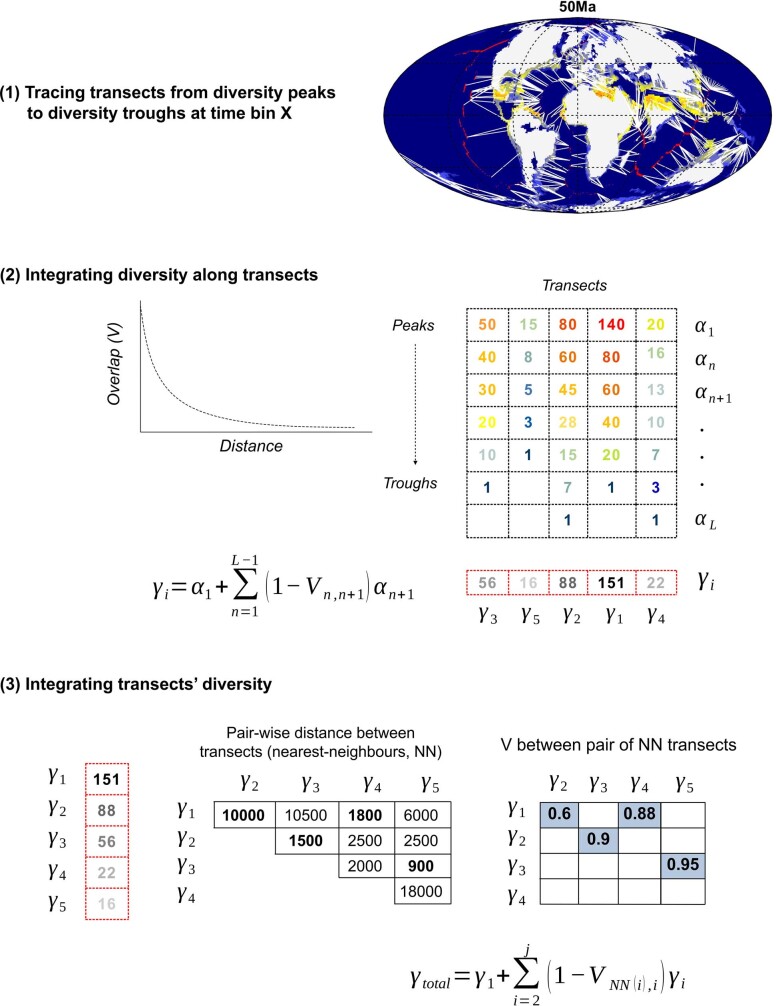
Extended Data Fig. 1. Computing global diversity from diversity maps.
For each time interval or regional diversity map, (1) we plot hundreds of transects (white lines) from diversity peaks to their nearest troughs (Supplementary Video 7 for an example), (2) we integrate diversity along the transects (from αð‘⟩ to αL) according to the distance between pairs of grids using the overlap coefficient (V), which gives the proportion of shared genera with respect to the grid with the least diversity, i.e. Vn, n+1 × min(αn; αn+1) [see Supplementary Note 1in SI], (3) we order the resulting transects’ diversity (γi) from maximum diversity (γmax) to minimum diversity (γmin), calculate the pair-wise distance between transects (the distance between their peaks), and integrate the diversity of transects from the greatest to lowest according to the nearest-neighbour distance of the corresponding transect to those transects already integrated (γtotal).

