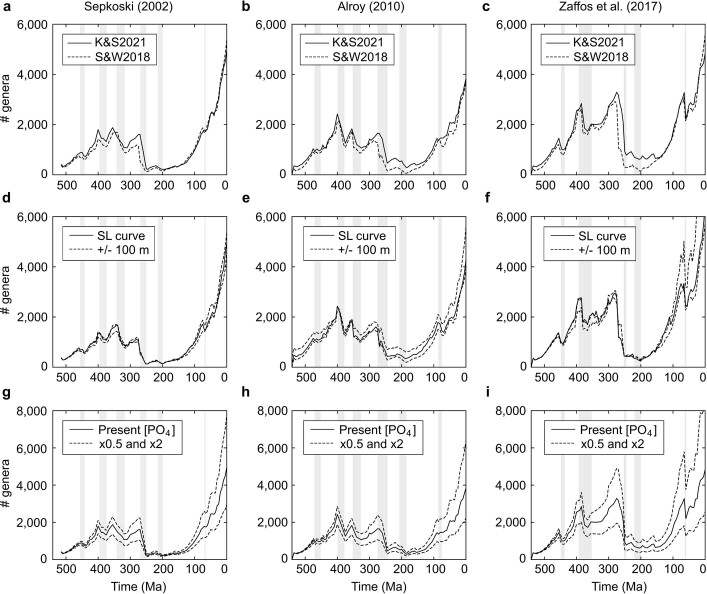
Extended Data Fig. 3. Sensitivity analysis.
a-c, Global diversity dynamics reconstructed by the exponential diversification model using two alternative palaeogeographic models33,35. d-f, Effect of changing the sea level +/− 100 m compared to the original palaeo-digital elevation model of Scotese and Wright33. g-i, Effect of changing the mean ocean phosphate concentration (x2 and x0.5 with respect to present day concentrations, i.e., default scenario). All simulations were run for each of the three mass extinction patterns, that is, Sepkoski20 (a, d, g), Alroy21 (b, e, h), and Zaffos et al22. (c, f, i).

