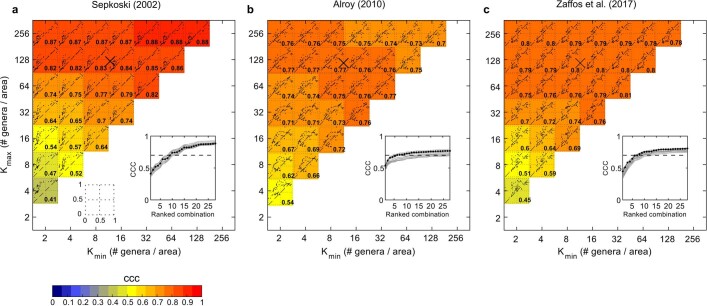
Extended Data Fig. 4. Calibrating the logistic model’s carrying capacities.
a-c, Lin’s concordance correlation coefficient (CCC) for the relationship between the global diversities resulting from the model and the fossil diversity estimates of Sepkoski20 (n = 66 data points) (a), Alroy21 (n = 60) (b), and Zaffos et al22 (n = 69) (c) using different combinations of Kmin and Kmax in the model. Only the time series data between the end of one mass extinction and the beginning of the next were included in the analysis .Superimposed on each combination of Kmin and Kmax are the scatterplots of the normalized (0-1) diversity data (model vs fossil). The inset in each panel shows the CCCs in ascending order for the different combinations of Kmin and Kmax. The black curve in the insets is for the simulation run using the selected parameters [i.e., Q10 = 1.75, Kfood = 0.5 molC m−2y−1, net diversification rate limits (ρmin − ρmax) = 0.001-0.035 Myr−1]. The grey curves are for each of the first 15 combinations of parameters listed in Extended Data Table 2. The dashed line denotes the CCC value of 0.7 and the cross in each panel is the average of all Kmin and Kmax combinations giving a CCC greater than 0.7. These are the values of Kmin and Kmax used to run the calibrated logistic model.

