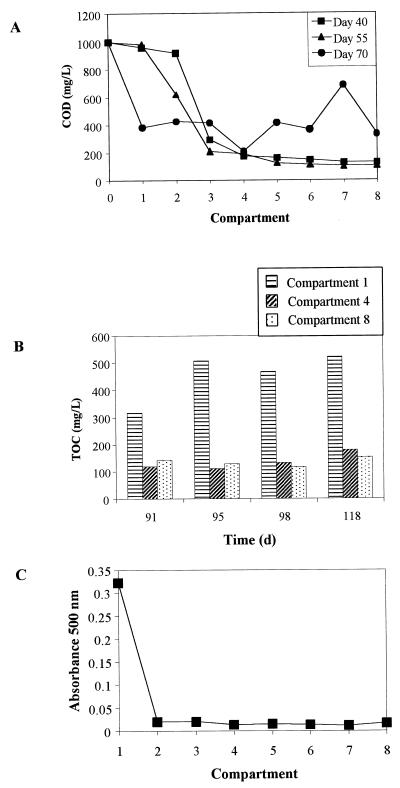
FIG. 1.
ABR performance. (A) Compartment COD levels before addition of the dye waste (days 40 and 55) and just after addition (day 70). (B) TOC levels in compartments 1, 4, and 8 after addition of the dye waste. (C) Profile of color removal in the ABR compartments measured by using absorbance at 500 nm for samples taken on day 100.

