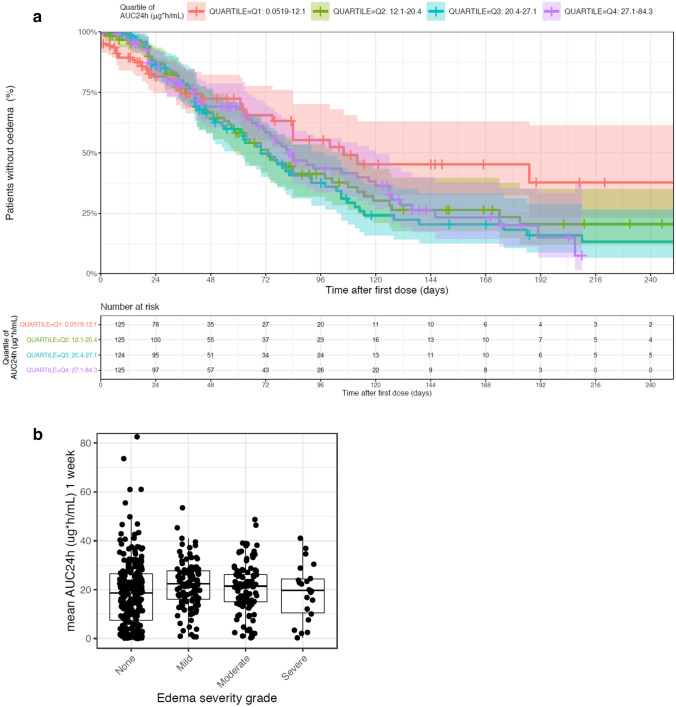
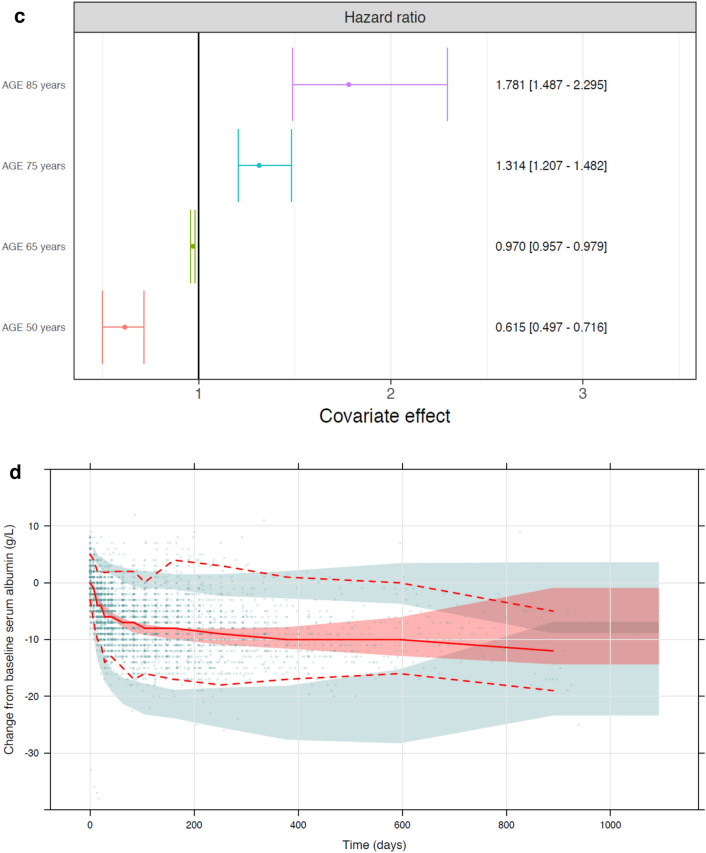
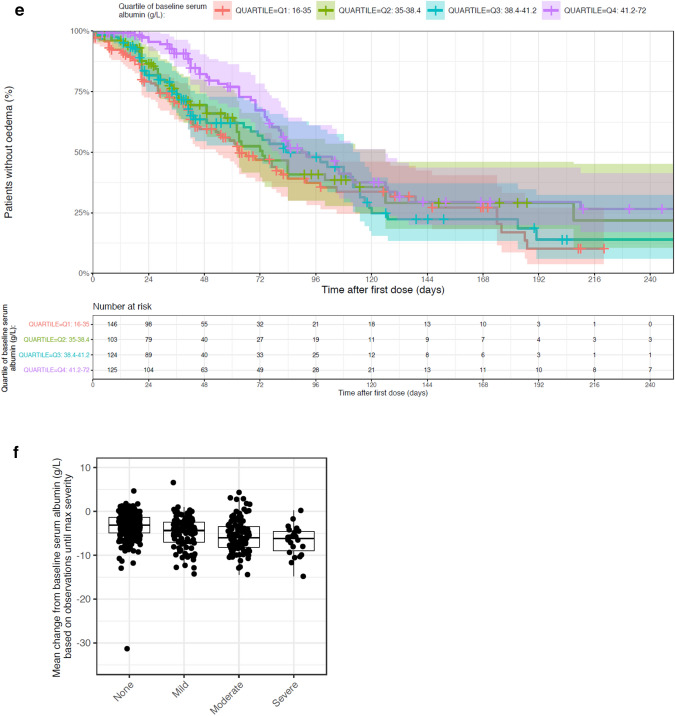
Fig. 2.
Relationship between tepotinib AUC24h quartile and edema events and change in serum albumin levels. Panel a presents time-to-first edema event stratified by tepotinib AUC24h quartile on the day of the edema event or day of censoring. Panel b presents the distribution of mean tepotinib AUC24h during 1 week prior to an edema event according to edema severity (maximum severity per participant). Panel c presents impact of age on the predicted risk of edema based on the final TTE model with model-estimated hazard ratios for edema relative to a typical participant of median age of 66 years (the closed symbols represent the median hazard ratio for the applicable age category. The whiskers represent the 90% CI of the median values, based on 100 bootstrap datasets. The vertical black line represents the hazard ratio for a typical patient in the analysis data set, aged 66 years). Panel d presents the visual predictive check of the indirect response model of serum albumin with an inhibitory effect of tepotinib exposure on albumin formation. In panels a and d, shaded areas represent 95% CI. In panel e, solid and dashed red lines represent the observed median, 5th and 95th percentiles; the shaded red area represents the 95% CI of the model predicted median, and the shaded blue areas represent the 95% CI of the model predicted 5th and 95th percentiles. Dots are observed values. Panel e presents a Kaplan–Meier analysis of time-to-first edema event stratified by quartiles of baseline serum albumin. Panel f presents mean change from baseline serum albumin according to edema severity. AUC24h, 24-h area under the curve; CI, confidence interval; TTE, time-to-event


