Fig. 5.
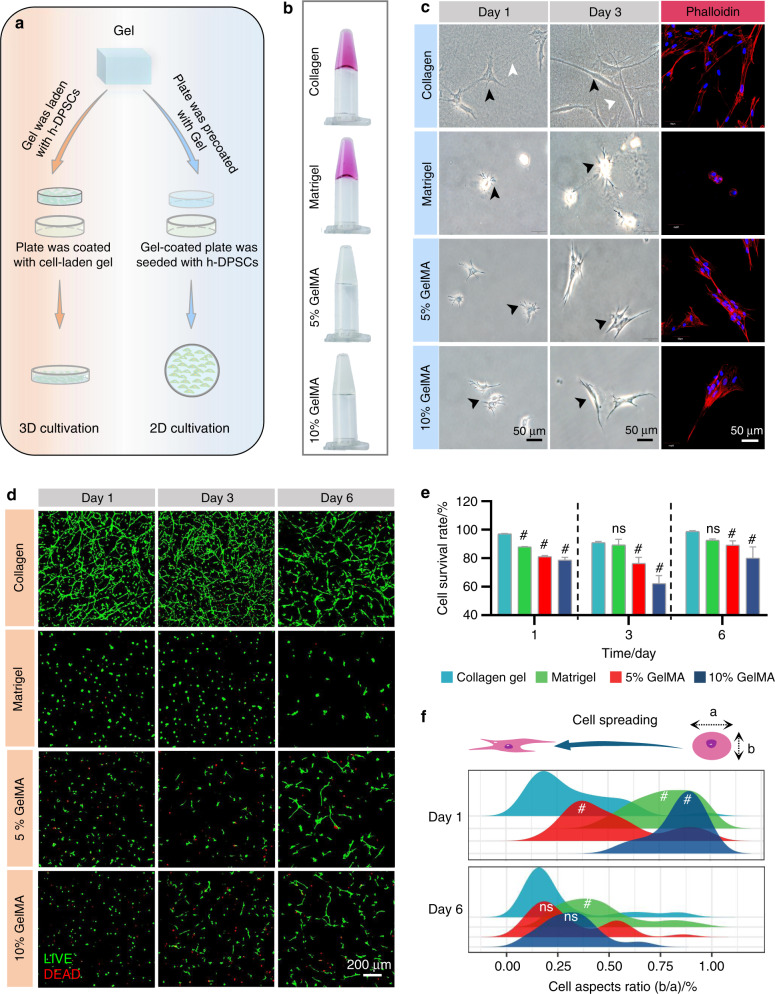
The morphology and viability of h-DPSCs in 2D and 3D culture systems. a Schematic diagram of the 2D and 3D culture with h-DPSCs in hydrogels. b Fabrication of the collagen gel, matrigel, 5% GelMA, 10% GelMA. c The optical pictures and phalloidin-labeled immunofluorescence pictures took from 2D cultured h-DPSCs on the surface of collagen gel, matrigel, 5% GelMA, and 10% GelMA on day 1 and day 3. d Live/dead staining pictures of 3D cultured h-DPSCs embedded into collagen gel, matrigel, 5% GelMA, 10% GelMA at days 1, 3, and 6. e Quantification analysis of the cell survival rate (live cells/dead cells). f The distribution analysis of cell aspect ratio (b/a) of h-DPSCs in collagen gel, matrigel, 5% GelMA, and 10% GelMA on day 1 and day 6 in d. *P < 0.05, #P < 0.01 vs collagen group. NS, no significance. Scale bar: c 50 μm, d 200 μm

