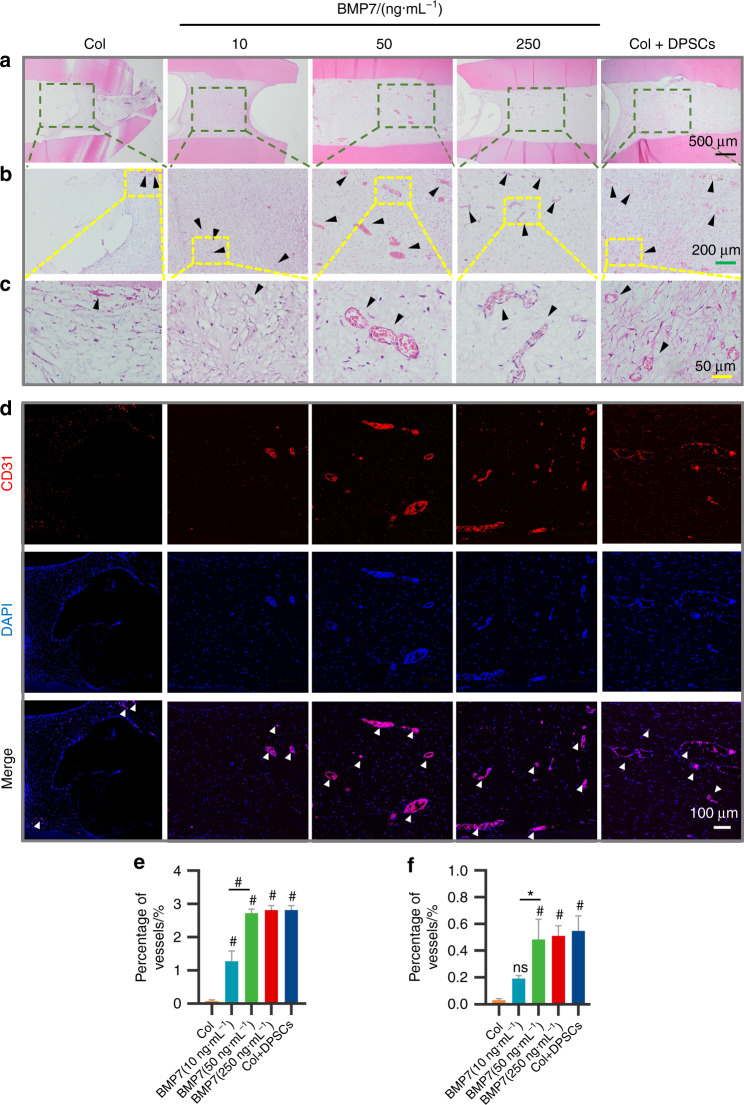
Fig. 8.
Analysis of angiogenesis in the transplants after 6 weeks of transplantation. a H&E staining of the selected regions of the transplants. b Enlarged regions of the black frames in a. c Enlarged regions of the yellow frames in b. The black arrowheads indicate the vessel structures in b and c. e Quantification of the relative areas of the vessels in c. d Immunofluorescent labeled CD31-positive vessels (white arrowheads) in the transplants. f Quantification of the relative areas of the vessels in d. *P < 0.05, #P < 0.01 vs the Col group. NS, no significance. Scale bar: a 500 μm, b 200 μm, c 50 μm, d 100 μm

