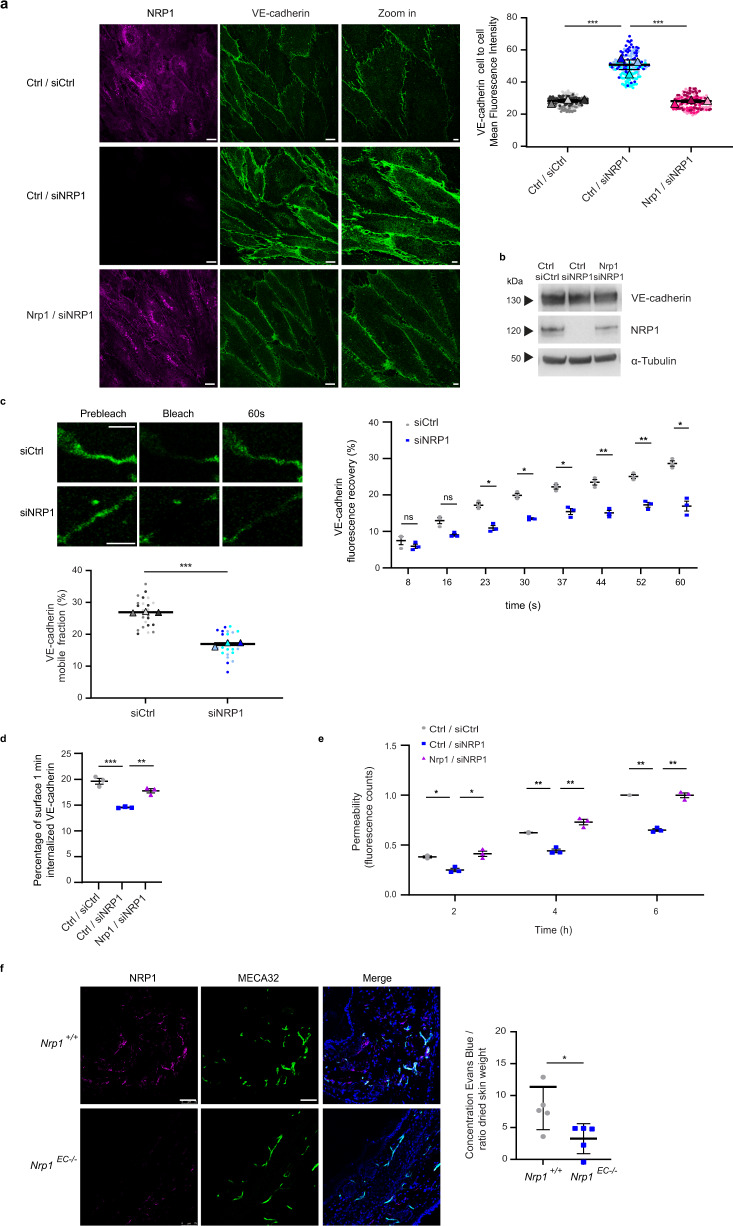
Fig. 4. NRP1 promotes VE-cadherin turnover and histamine-elicited endothelial permeability.
a NRP1 impairs VE-cadherin localization at endothelial cell-to-cell contacts. Confocal microscopy on control (siCtrl) or NRP1 (siNRP1) silenced ECs rescued with empty vector (Ctrl/siCtrl and Ctrl/siNRP1) or with mouse Nrp1 (Nrp1/siNRP1) and stained for NRP1 (magenta) and VE-cadherin (green) and quantification of VE-cadherin fluorescence intensity in AJs. Scale bar 10 µm. Mean ± SEM of three independent experiments (depicted in different colors). One-way ANOVA with Bonferroni correction; ***P value = 0.0004. b NRP1 silencing does not affect VE-cadherin protein levels. A representative experiment of three is shown. c FRAP analysis reveals NRP1 promotes VE-cadherin turnover at AJs in ECs transduced with VE-cadherin-mCherry and silenced or not for NRP1. Above, VE-cadherin fluorescence recovery = normalized signal in each cell before and after photobleaching to 100% and 0%. Three independent experiments (8 cells each) mean ± SEM is shown. Below, mobile fraction = fluorescence recovered post-bleach —after photobleaching/pre-bleach ROI fluorescence—after photobleaching. Mean of three independent experiments ± SEM is shown. Scale bar 5 µm. Two-way ANOVA with Bonferroni correction; ns = P value ≥ 0.05, *P value ≤ 0.05, **P value ≤ 0.01, ***P value = 0.000028. d NRP1 promotes VE-cadherin internalization. VE-cadherin endocytosis in Ctrl/siCtrl, Ctrl/siNRP1 or Nrp1/siNRP1 ECs measured by capture ELISA. Mean ± SEM of three independent experiments is shown. One-way ANOVA with Bonferroni correction; **P value = 0.0037, ***P value = 0.0003. e NRP1 sustains histamine-elicited endothelial permeability. Quantification of Dextran through Ctrl/siCtrl, Ctrl/siNRP1 or Nrp1/siNRP1 EC monolayer after histamine. Mean ± SEM of three independent experiments is shown. Two-way ANOVA with Bonferroni correction; *P value ≤ 0.05, **P value ≤ 0.01. f Vascular permeability reduction in Nrp1EC−/− mice. Left, confocal microscopy on Nrp1+/+ or Nrp1EC−/− mice ear sections stained for NRP1 (magenta), MECA32 (green), and DAPI (blue). Scale bar 75 µm. Right, histamine permeability in Nrp1+/+ or Nrp1EC−/− mice (Evans Blue/skin weight). Data are mean ± SD (n = 5 per group). Two-tailed heteroscedastic Student’s t test; *P value = 0.0321. Source data are provided as Source Data file.

