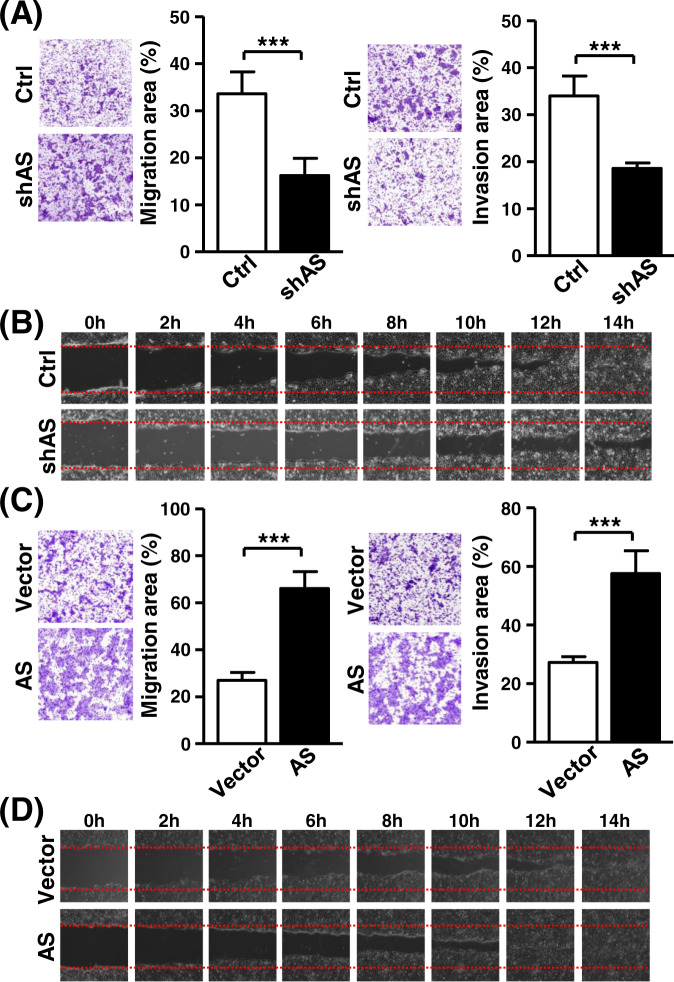
Fig. 5. HOXA10-AS expression determines the metastatic potential of cancer cells.
A Transwell migration (left) and Matrigel invasion (right) assays of control and HOXA10-AS knockdown cells were performed. Representative photographs are shown. The average migratory area per field was quantified and expressed in the bar graph (n = 3). B Wound-healing assay of HOXA10-AS knockdown cells was performed. Cell migration at indicated time points was recorded and shown in the representative photographs (n = 3). C Transwell migration and invasion assays of HOXA10-AS-overexpressing cells were carried out (n = 3). Migration and invasion abilities were quantified and shown in the bar graph. D HOXA10-AS-overexpressing cells were subjected to a wound-healing assay (n = 3). Cell migration was recorded and shown in the representative photographs.

