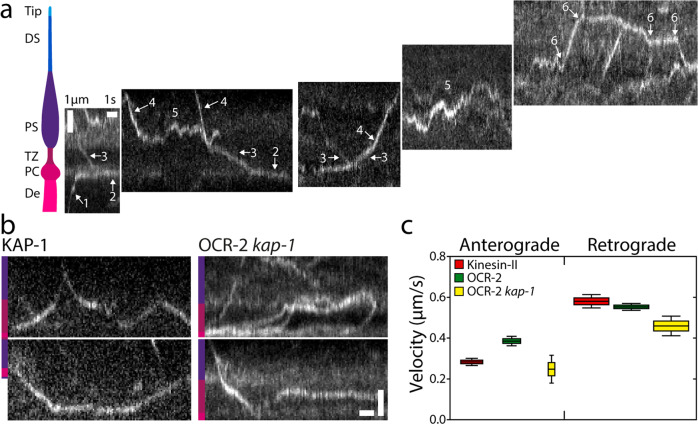
Fig. 2. Single-molecule imaging of OCR-2.
a Cartoon of the ciliary segments and representative single-molecule kymographs of OCR-2::EGFP. Scale bars, vertical: 1 μm, horizontal: 1 s. b Single-molecule kymographs showing TZ crossings of Kinesin-II (KAP-1::EGFP) and OCR-2::EGFP kap-1(ok676). Color bars indicate ciliary segment as in (A). Scale bars, vertical: 1 μm; horizontal: 1 s. c Anterograde (A) and retrograde (R) velocity of KAP-1::EGFP (A: 63 trajectories; R: 273 trajectories), OCR-2::EGFP (A: 51 trajectories; R: 297 trajectories) and OCR-2::EGFP kap-1(ok676) (A: 19 trajectories; R 141 trajectories). Velocities were extracted using KymographDirect from kymographs optimized for the TZ (a different data set than used in the rest of the manuscript). Data are represented as boxplot. Indicated are median (block horizontal line), 25th–75th percentile (height of the colored boxes), 5th–95th percentile. The widths of the boxes represent the sample size.

