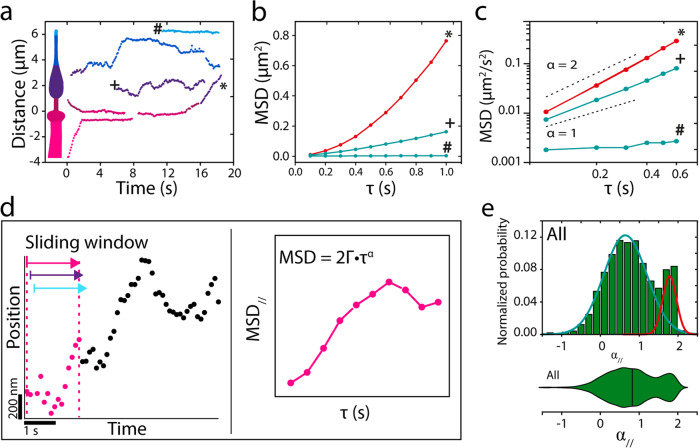
Fig. 3. Analysis of single-molecule OCR-2 trajectories.
a Example single-particle trajectories from the kymographs of Fig. 2a. b Mean squared displacement (MSD) of annotated trajectories in a, demonstrating active transport (*), normal diffusion (+), and subdiffusion (#). c Log–log plot of the first six time points. d Cartoon explaining the single-molecule data analysis with a sliding window. e Histogram and corresponding violin plot of normalized probability of α// for all 7237 data points obtained from 23 nematodes. Colored lines represent two underlying Gaussian distributions.

