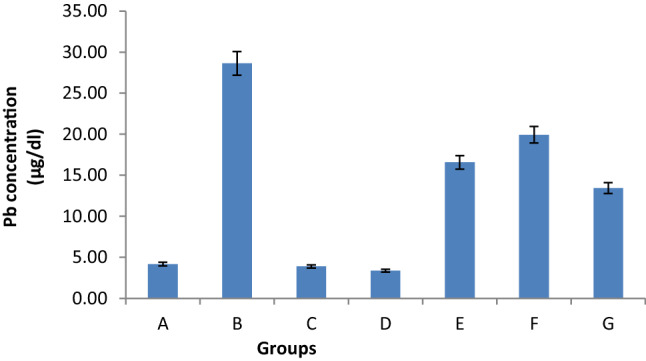
Fig. 1.

Effect of Pb, CUR and QUE and their co-treatment on Pb concentration in blood of rats. Values are mean ± SE (n = 8). Significant change at P < 0.001 in B with respect to values in control group A. Significant change at P < 0.001 in E, F, G with respect to values in group B. Group A-Control; Group B-Lead acetate (Pb) only; Group C-Curcumin (CUR) only; Group D-Quercetin (QUE) only; Group E-Pb + CUR; Group F-Pb + QUE; Group G- Pb + CUR + QUE
