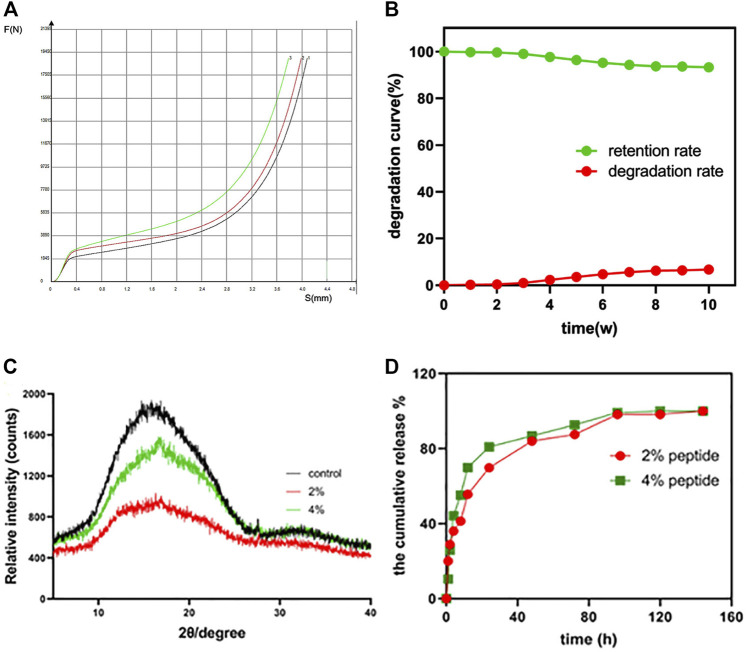
FIGURE 2.
(A) The compressive strength (force-displacement curve) of the PLGA scaffold (n = 3). (B) The in vitro degradation behavior of the PLGA scaffold. (C) XRD patterns of the raw PLGA scaffold and the peptide-loaded scaffolds; (D) the in vitro peptide release profile of the 2% and 4% peptide-loaded PLGA scaffolds.

