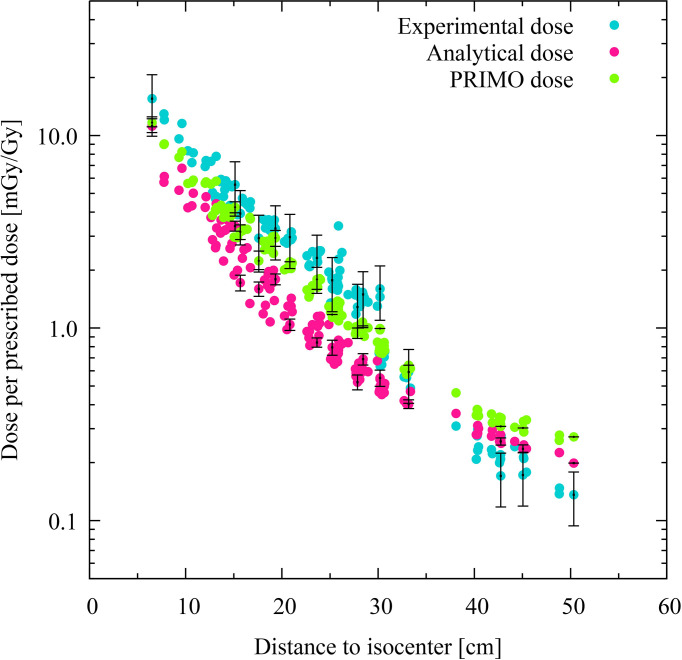
Figure 3.
Comparison of experimental, analytical, and simulated data for volumetric modulated arc therapy. Each colored dot represents one thermoluminescent dosimeter (TLD) position. The distance of the TLD position to the isocenter (in centimeters) is given on the abscissas, while the dose per prescribed dose (mGy/Gy) in logarithmic scale are indicated on the ordinates. The experimental dose distribution is shown with turquoise dots, the analytically calculated absorbed doses with pink dots, and the PRIMO-simulated data with green dots. Statistical uncertainties (k = 2) are plotted for every twentieth TLD position.

