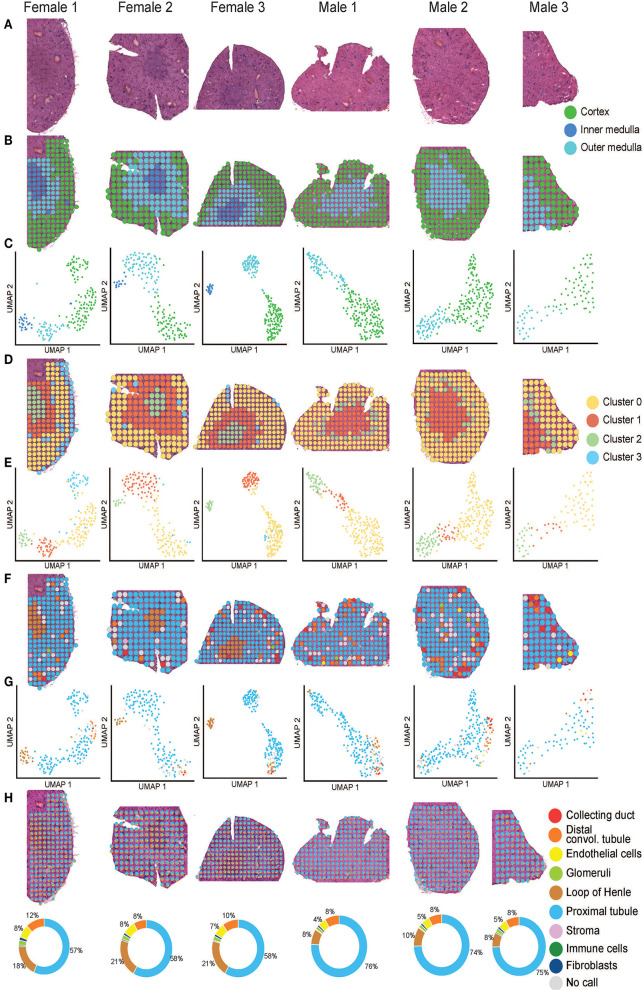
Figure 2.
Mouse ST-seq consensus labels. (A) H&E images of the mouse kidney tissues from three females and three males. (B, C) The functional cortical and medullary regions, which were annotated within the mouse ST-seq datasets by a Consultant Pathologist were mapped to the H&E tissue sections and presented in the UMAP. (D, E) The spatial organization of the KNN clusters was mapped to the H&E tissue images and presented in a UMAP. (F,G) The spatial organization of the consensus-based label transfer results was mapped to the H&E tissue images and presented in a UMAP, respectively. (H) The spatial organization of the deconvoluted functional structures was mapped to the H&E tissue images and presented as simple pie charts to demonstrate the proportions.

