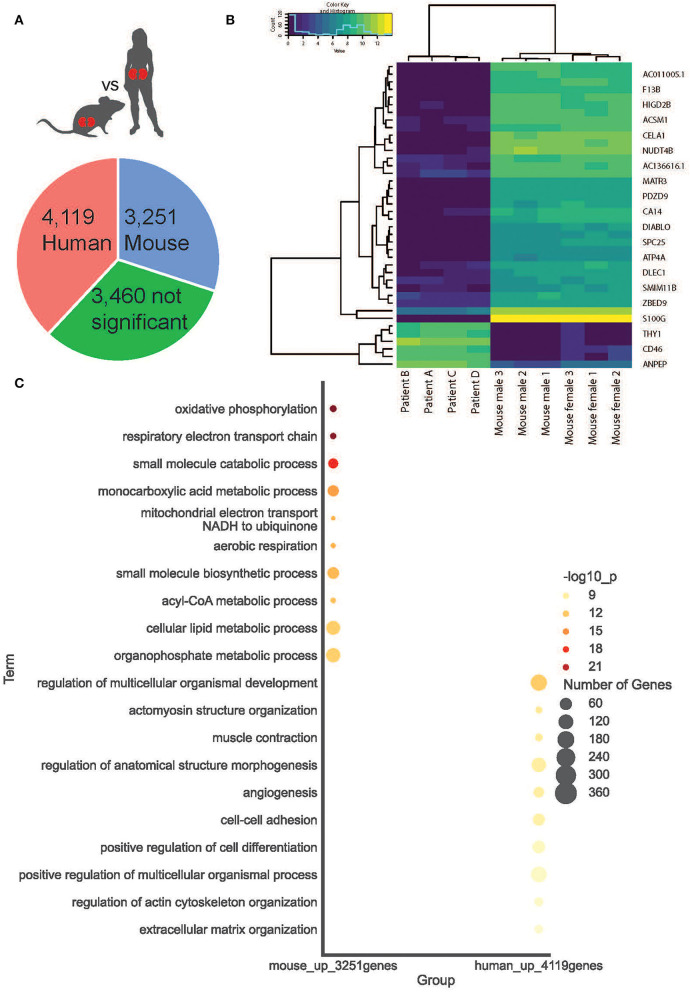
Figure 4.
Cortical kidney genes differentially expressed between species. (A) A simple pie chart demonstrates the proportion of statistically significant DE genes identified within each species. (B) The top 20 DE genes between species are presented as a heat map. (C) Within mice and humans, the top 10 statistically significant Gene Ontology Biological Processes.

