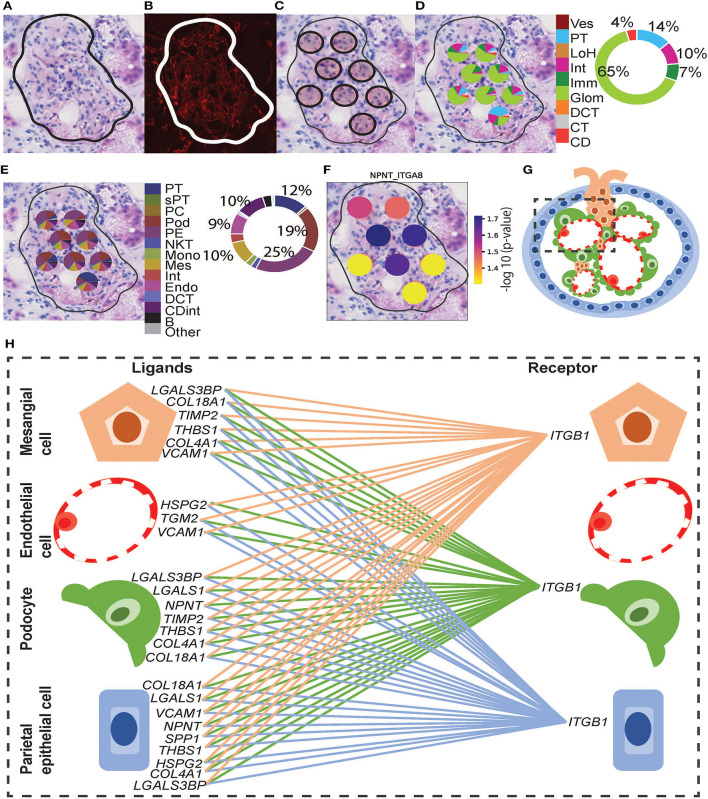
Figure 5.
Integrative analysis of glomerular morphology, deconvolution, and cellular interactions in patient D. To confirm the morphology of glomerular functional structures, we investigated H&E and mIF images within a selected glomerulus. (A) Zoomed-in H&E image of the selected glomerulus annotated by the pathologist. (B) Anti-CD31 (red) immunofluorescence staining confirms the presence of endothelial cells and validates the pathologist's glomerular annotation. Next, we visualized the ST-spots underlying the glomerulus. (C) The positions of the eight underlying ST-spots were mapped within the selected glomerulus. To perform deconvolution, we selected the ST-spots identified by label transfer as glomeruli. (D) Deconvolution at the functional structure level for the selected glomerulus was mapped to the H&E image. The pie chart provides a summary of functional structures underlying all glomerular ST-spots in the entire tissue section for patient D. (E) Deconvolution at a cell-type level for the selected glomerulus was mapped to the H&E image. The pie chart provides a summary of the cell types underlying all glomerular ST-spots in the entire tissue section for patient D. Finally, we investigated our ST-seq datasets for cellular interactions in glomerular ST-spots. (F) The spatial expression of the NPNT-ITGA8 L–R gene pair for the selected glomerulus was mapped to the H&E image. (G) A diagrammatic presentation of parietal epithelial, podocytes, endothelial, and mesangial cells that form the functional glomerular structures in mammalian cortical kidney regions. (H) The cellular interaction involved in extracellular matrix maintenance within the glomerulus for integrin receptor ITGB1 was mapped between the glomerular cell types.

