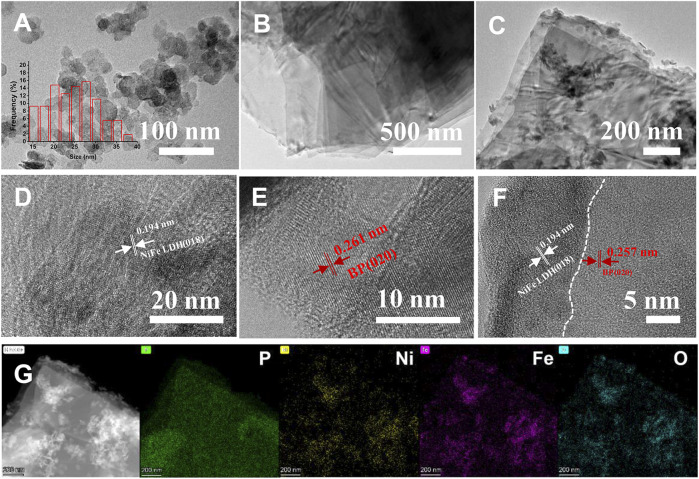
FIGURE 2.
(A) TEM image of NiFe-LDH (inset is the histogram of lateral size distribution), (B) high-resolution transmission electron microscope (HRTEM) image of NiFe LDH, (C) TEM image of EBP nanoflakes, (D) HRTEM image of EBP, (E) TEM image of NiFe LDH@EBP, (F) HRTEM image of NiFe LDH@EBP and its corresponded distance of crystal planes, and (G) HAADF-STEM image and EDS element mapping images of P, Ni, Fe, and elements.

