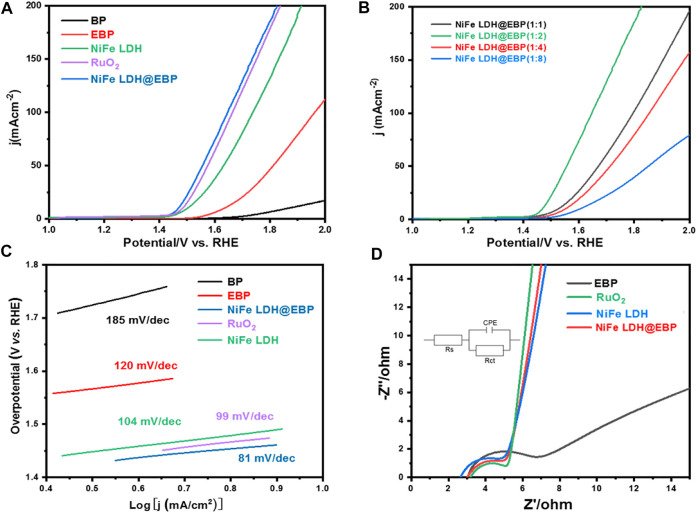
FIGURE 5.
(A) LSV curves for BP, EBP, NiFe-LDH and NiFe LDH@EBP, and RuO2, (B) LSV curves of NiFe LDH@EBP samples with different feed weight ratios of NiFe-LDH to EBP, (C) Tafel plots for BP, EBP, NiFe-LDH and NiFe LDH@EBP, and commercial RuO2, and (D) EIS curves for EBP, NiFe-LDH and NiFe LDH@EBP, and commercial RuO2.

