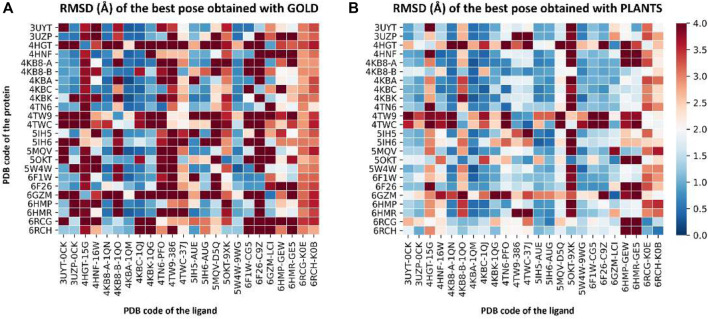
FIGURE 2.
Two heatmaps that summarize the results of the cross-docking experiment performed before the Autogrow runs to select the protein structure to use for subsequent calculations. Panel (A) reports the results for the GOLD-Chemscore protocol, while Panel (B) encompasses the results of the PLANTS-PLANTSChemPLP one. On the vertical axis, the PDB code of the protein is reported, while on the horizontal axis the PDB code of the ligand is indicated. The colored squares report the RMSD values for the best docking pose generated by the two docking protocols according to the color bar located on the right side of the image: color ranges from blue (indicating a low RMSD; minimum value is 0 Å, indicating a perfect superposition between the docking pose and the crystal reference) to red (maximum value is 4 Å, indicating a high deviation between the docking pose and the crystal reference).

