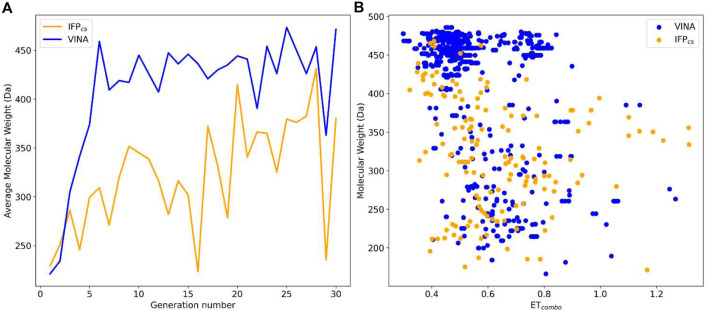
FIGURE 4.
Comparison of the performance of the two Autogrow protocols in the benchmark de novo runs regarding their ability to generate compounds that pass the pharmacophore filter. The VINA protocol is reported as a blue line, while the IFPCS one is reported as an orange line. Panel (A) depicts, for each protocol, the average molecular weight of compounds within the population that pass the pharmacophore filter on a per-generation basis. The vertical axis reports the molecular weight, while the horizontal axis reports the generation number. Panel (B) depicts, for each protocol, the distribution of generated compounds that pass the pharmacophore filter regarding their molecular weight and the similarity of shape and electrostatic properties to crystal inhibitors taken as reference. The vertical axis reports the average molecular weight in Da, while the horizontal axis reports the ET combo value. Blue dots represent compounds generated by the VINA protocol, while orange dots represent compounds generated by the IFPCS one.

